
As a researcher deeply involved in the development of lithium-ion batteries, I have focused on the critical role of self-discharge screening in ensuring the reliability and longevity of battery packs, particularly those utilizing lifepo4 battery technology. The widespread adoption of lifepo4 battery systems in electric vehicles and energy storage underscores the necessity for robust quality control measures. Self-discharge, if undetected, can severely compromise the performance and cycle life of battery packs composed of hundreds of cells in series and parallel configurations. This article presents a comprehensive study on the influence of different formation processes on the accuracy of self-discharge screening for lifepo4 battery cells, employing the K-value method, electrochemical impedance spectroscopy (EIS), and cycle performance analysis. The goal is to establish an optimal formation protocol that enhances screening efficacy and overall battery consistency.
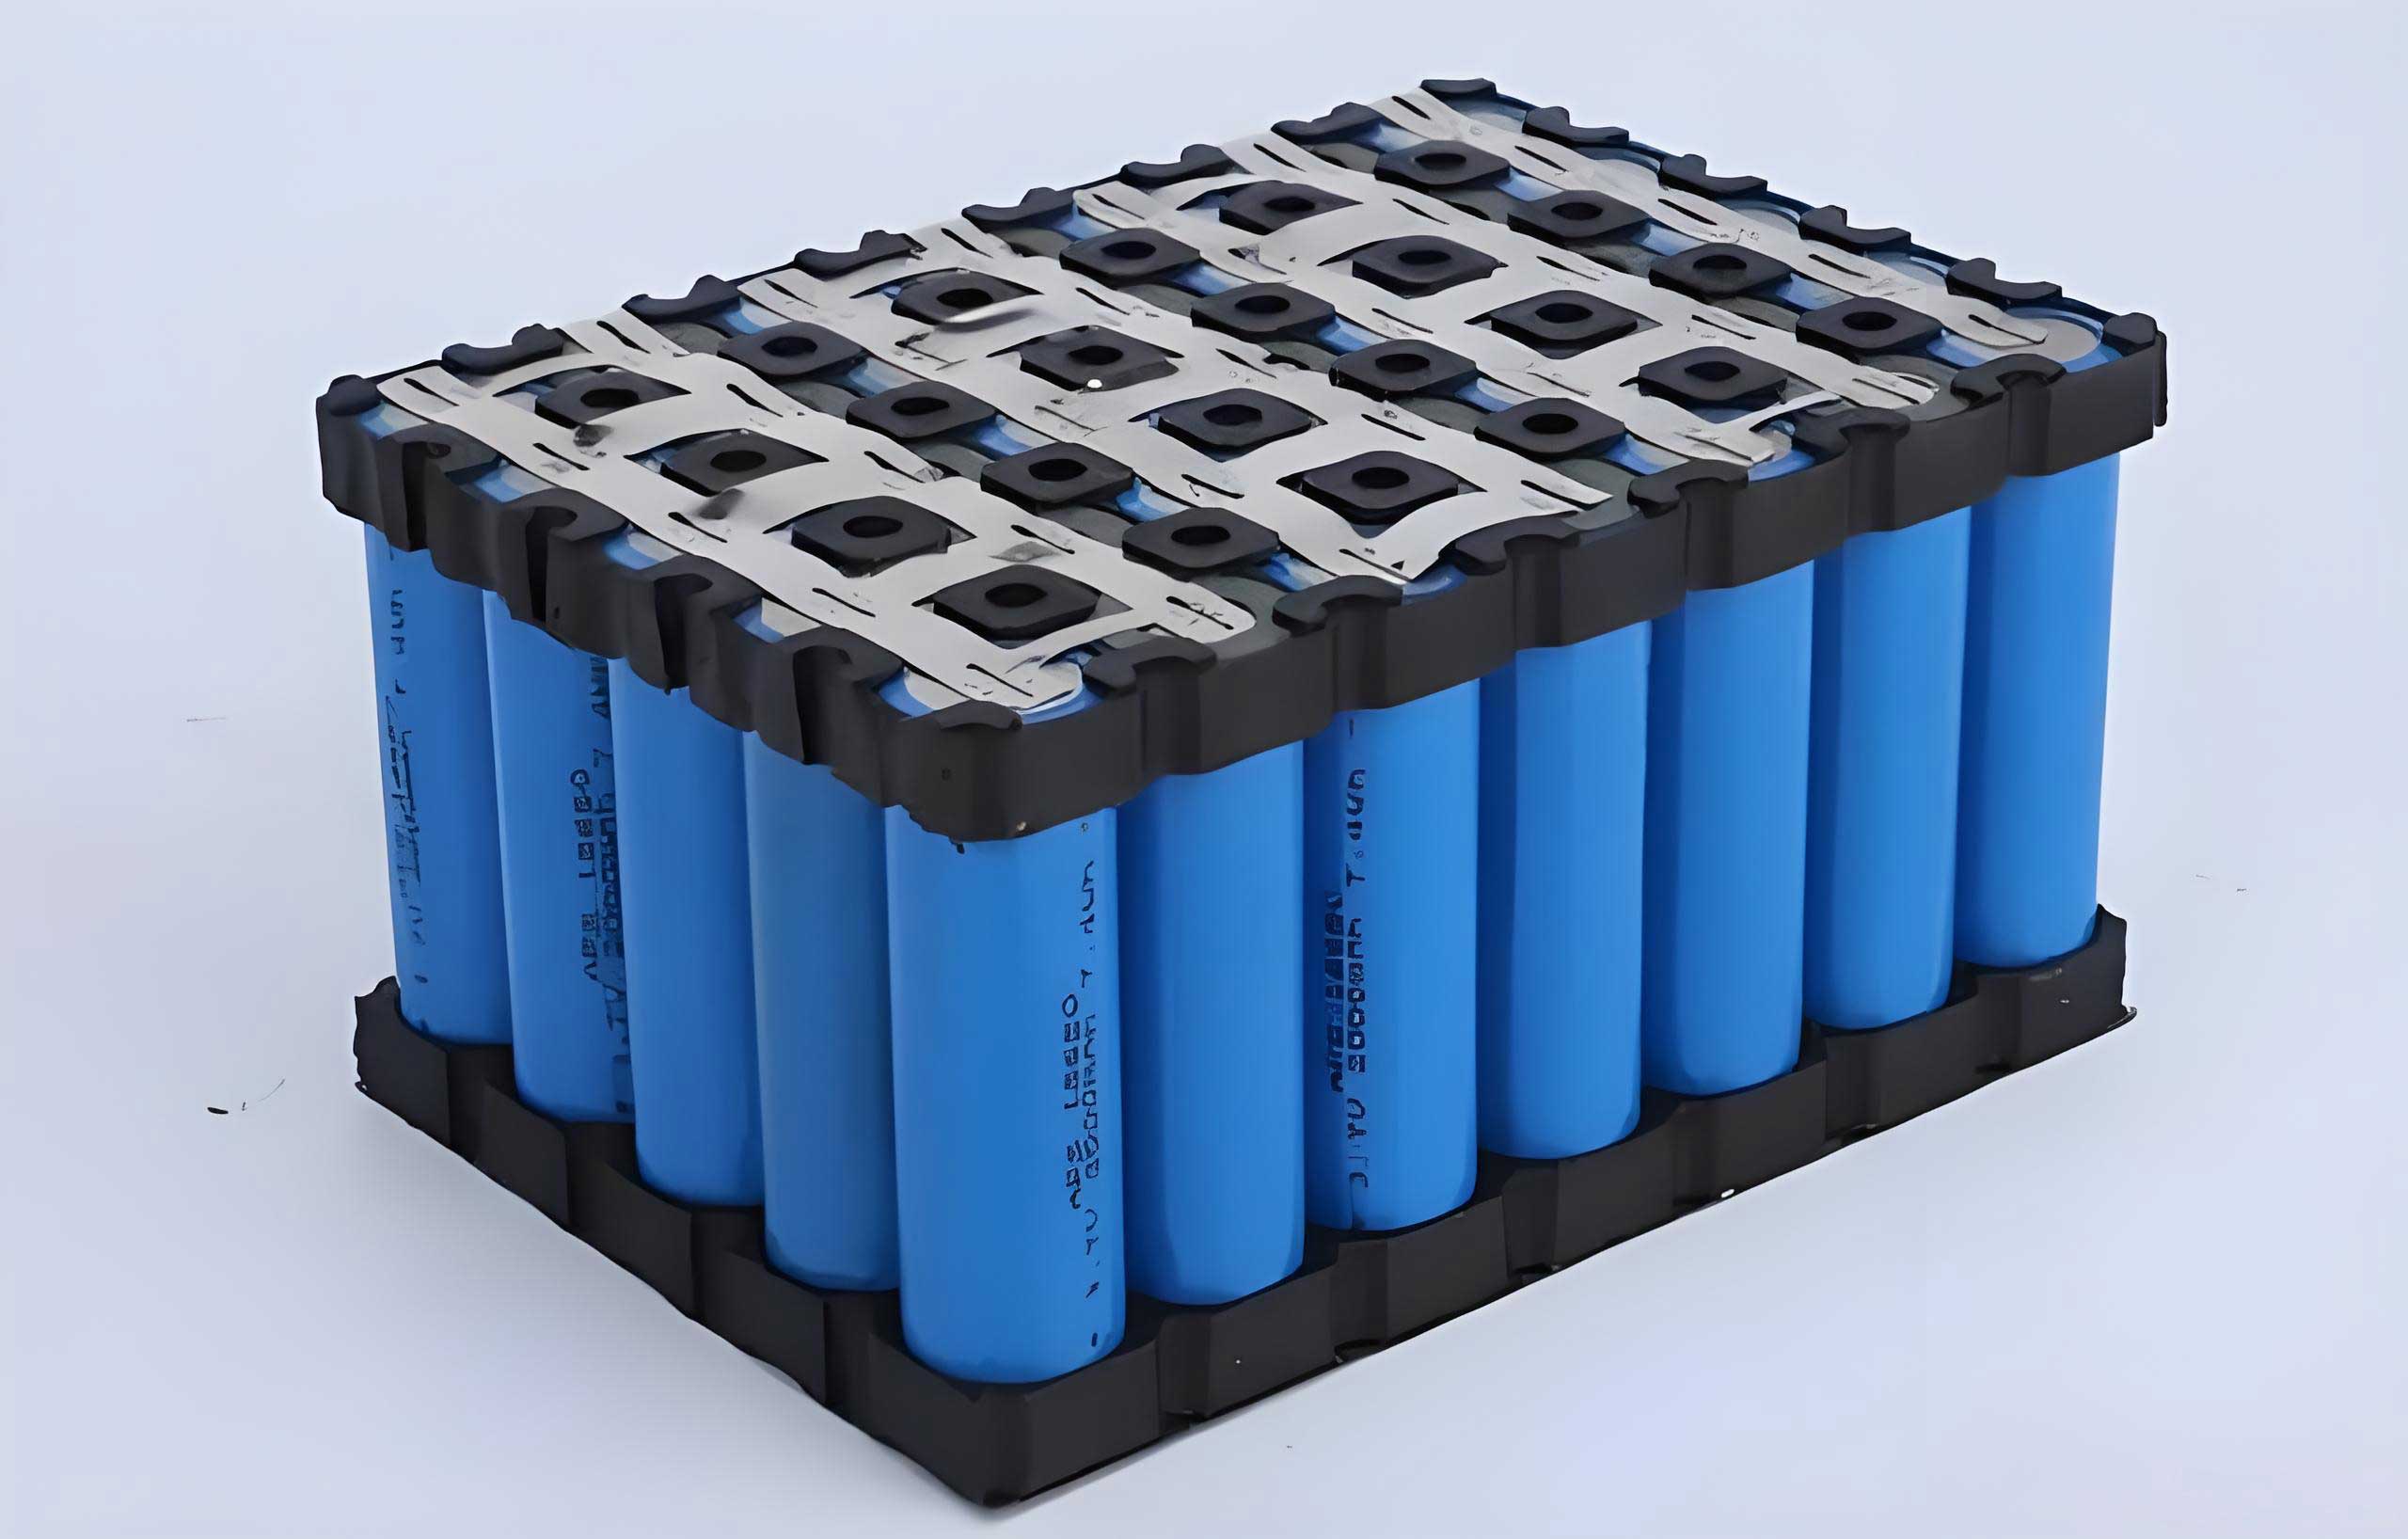
The fundamental challenge with lifepo4 battery cells lies in the inherent variability during manufacturing, which can lead to differential self-discharge rates. Self-discharge in a lifepo4 battery primarily results from parasitic reactions within the cell, such as electrolyte decomposition, slow redox shuttle mechanisms, or micro-shorts. These reactions cause a gradual voltage drop when the battery is at rest, which is detrimental in pack applications. Even a single lifepo4 battery cell with high self-discharge can imbalance the entire pack, accelerating capacity fade and reducing safety. Therefore, developing a precise and reliable screening method is paramount for the lifepo4 battery industry. The K-value method, based on the open-circuit voltage (OCV) decay over time, is a common industrial approach. However, its effectiveness is highly dependent on the prior formation and aging conditions the lifepo4 battery undergoes. This study systematically investigates three distinct formation protocols to determine which one yields the most stable and accurately screenable lifepo4 battery population.
In my experimental setup, I utilized prismatic lifepo4 battery cells manufactured in-house. The positive electrode was composed of LiFePO₄, conductive carbon, and PVDF binder, while the negative electrode used artificial graphite. The cells were wound and assembled following standard procedures. The core of the experiment involved subjecting cells from the same production batch to three different formation and aging processes, labeled as Process 1, Process 2, and Process 3. The detailed conditions are summarized in Table 1. The primary variable was the state-of-charge (SOC) during the key aging period, which is hypothesized to significantly affect the solid electrolyte interphase (SEI) formation and subsequent self-discharge behavior of the lifepo4 battery.
| Process ID | Formation Step | Aging Condition | Post-Processing | Self-Discharge Screening Phase |
|---|---|---|---|---|
| Process 1 | Charge to 100% SOC, discharge to 2.5V (~30% SOC) | Room temperature (25±5°C) for 10 days | Room temperature rest for 2.5 days | OCV measured after 12.5 days total rest |
| Process 2 | Charge to 100% SOC, discharge to 70% SOC | Room temperature (25±5°C) for 10 days | Charge to 100% SOC, discharge to 2.5V, charge to 30% SOC | OCV measured after 2.5 days and 10 days rest |
| Process 3 | Charge to 100% SOC | Room temperature (25±5°C) for 10 days | Charge to 100% SOC, discharge to 2.5V, charge to 30% SOC | OCV measured after 2.5 days and 10 days rest |
The self-discharge screening was based on the K-value method. The open-circuit voltage (OCV) of each lifepo4 battery was measured at multiple time intervals during an extended room temperature storage period. The K-value for any interval is defined as the average voltage drop per day. For instance, the K-value between time t₁ and t₂ is calculated as:
$$K_{12} = \frac{OCV_1 – OCV_2}{t_2 – t_1}$$
where OCV₁ and OCV₂ are the voltages at times t₁ and t₂, respectively. A higher K-value indicates a higher self-discharge rate. Cells with a K-value exceeding a predefined threshold are flagged as high self-discharge units. In this study, I monitored the lifepo4 battery cells for over 300 days to validate the stability of the initial screening. The voltage measurement schedule is detailed in Table 2. This long-term monitoring is crucial to distinguish between temporary voltage relaxation and true, persistent self-discharge in a lifepo4 battery.
| Process ID | OCV₁ | OCV₂ | OCV₃ | OCV₄ | OCV₅ | OCV₆ | OCV₇ |
|---|---|---|---|---|---|---|---|
| Process 1 | 12.5 | 22.5 | 30 | 60 | 100 | 160 | 310 |
| Process 2 | 2.5 | 12.5 | 30 | 60 | 100 | 160 | 310 |
| Process 3 | 2.5 | 12.5 | 30 | 60 | 100 | 160 | 310 |
The initial self-discharge screening results, based on K₁₂, revealed striking differences between the processes. For the lifepo4 battery group subjected to Process 1, the voltage distribution was wide, and several cells showed K-values above the threshold. However, during long-term monitoring, new cells exhibited elevated K-values at later stages (e.g., K₁₇), indicating poor consistency and potential missed detections or false positives in the initial screen. This suggests that the formation protocol for Process 1 did not stabilize the lifepo4 battery cells adequately. In contrast, the lifepo4 battery cells from Process 2 and Process 3 showed a much tighter voltage distribution. The cells identified as high self-discharge units at the initial screen (based on K₁₂) remained the only outliers throughout the entire 310-day monitoring period, with no new cells developing high self-discharge. This demonstrates a stable and accurately screened population. The self-discharge detection rates and K-value thresholds are compared in Table 3. The data clearly shows that Process 2 and Process 3 yield a more reliable and consistent lifepo4 battery output, with a self-discharge rate of around 1.8% that is accurately captured early on.
| K-value Interval | Process 1 Threshold (mV/day) | Process 1 Detection Rate (%) | Process 2 Threshold (mV/day) | Process 2 Detection Rate (%) | Process 3 Threshold (mV/day) | Process 3 Detection Rate (%) |
|---|---|---|---|---|---|---|
| K₁₂ | 0.10 | 0.60 | 0.25 | 1.79 | 0.25 | 1.85 |
| K₁₃ | 0.08 | 0.90 | 0.16 | 1.79 | 0.16 | 1.85 |
| K₁₄ | 0.06 | 2.17 | 0.11 | 1.79 | 0.10 | 1.85 |
| K₁₅ | 0.08 | 2.91 | 0.06 | 1.79 | 0.06 | 1.85 |
| K₁₆ | 0.10 | 2.17 | 0.05 | 1.79 | 0.05 | 1.85 |
| K₁₇ | 0.08 | 2.19 | 0.03 | 1.79 | 0.03 | 1.85 |
To understand the root cause of these differences, I analyzed the initial discharge capacity and coulombic efficiency of the lifepo4 battery cells. As shown in Table 4, the lifepo4 battery cells from Process 1 exhibited the highest initial discharge capacity and first-cycle efficiency. At first glance, this might seem advantageous. However, after the long-term storage and a subsequent refresh cycle, the actual recoverable capacity of all groups converged to a similar value. This indicates that the high initial capacity for Process 1 was “virtual” or inflated, likely due to an incomplete or less stable SEI layer that continued to evolve during storage, consuming lithium ions. In contrast, the lifepo4 battery cells from Process 2 and Process 3, which underwent aging at high SOC (100% SOC for Process 3, 70% SOC for Process 2), had lower first-cycle efficiency. This is because the high SOC aging accelerates parasitic reactions that form a more robust and passivating SEI layer upfront, leading to greater initial irreversible capacity loss but superior long-term stability. This trade-off is beneficial for the consistency and shelf-life of the lifepo4 battery.
| Process ID | Average Initial Discharge Capacity (Ah) | First-Cycle Efficiency (%) | Recovered Capacity after Storage (Ah) | Residual Capacity Rate (%) | Recovery Capacity Rate (%) |
|---|---|---|---|---|---|
| Process 1 | 80.02 | 92.41 | 76.84 | 82.78 | 96.04 |
| Process 2 | 78.66 | 90.54 | 76.76 | 89.40 | 97.57 |
| Process 3 | 78.25 | 90.28 | 76.35 | 89.67 | 97.57 |
The residual capacity rate and recovery capacity rate further highlight the superiority of Process 2 and Process 3 for lifepo4 battery conditioning. The residual capacity rate is the percentage of initial capacity remaining after long storage, while the recovery rate is the percentage of initial capacity that can be restored after a refresh charge. The data shows that lifepo4 battery cells from Processes 2 and 3 retained a higher percentage of their capacity during storage (nearly 90%) and recovered a higher percentage (over 97.5%) compared to Process 1. This is a direct consequence of a more stable SEI layer. The aging at elevated SOC forces the majority of detrimental side reactions to occur in a controlled manner during the formation stage, rather than sporadically during the battery’s shelf life or service. This results in a lifepo4 battery with minimal subsequent capacity fade and excellent voltage holding capability, which is essential for accurate self-discharge screening.
Cycle life testing provided another critical perspective. I conducted long-term cycling tests on lifepo4 battery cells from Process 1 and Process 3 to compare their performance degradation. The capacity retention over 3000 cycles is depicted in Figure 1 (conceptual description). While both groups started with similar capacity, the lifepo4 battery cells from Process 3 exhibited significantly better capacity retention at the 3000-cycle mark. The capacity fade can be modeled using a general empirical equation for battery aging:
$$Q_{loss} = A \cdot \exp\left(-\frac{E_a}{RT}\right) \cdot (t)^n$$
Where \(Q_{loss}\) is the capacity loss, \(A\) is a pre-exponential factor, \(E_a\) is the activation energy for the degradation reaction, \(R\) is the gas constant, \(T\) is temperature, \(t\) is time or cycle number, and \(n\) is the power-law exponent. A more stable SEI, as formed in Process 3, increases the effective activation energy \(E_a\) for parasitic reactions, thereby reducing \(Q_{loss}\) over time. The superior cycle life of the Process 3 lifepo4 battery confirms that its formation protocol leads to a more durable electrode-electrolyte interface.
Electrochemical Impedance Spectroscopy (EIS) was employed to probe the interfacial properties of the lifepo4 battery cells directly. A typical Nyquist plot for a lifepo4 battery consists of a high-frequency intercept related to ohmic resistance (Rₛ), a depressed semicircle in the high-to-medium frequency range associated with the SEI layer resistance (Rₛₑᵢ) and charge transfer resistance (Rₜ), and a low-frequency tail related to lithium-ion diffusion in the solid phase. The equivalent circuit model is often represented as:
$$Z(\omega) = R_s + \frac{1}{j\omega C_{dl} + \frac{1}{R_{ct}}} + \frac{1}{j\omega C_{SEI} + \frac{1}{R_{SEI}}} + Z_W$$
Where \(Z(\omega)\) is the complex impedance, \(\omega\) is the angular frequency, \(C_{dl}\) is the double-layer capacitance, \(C_{SEI}\) is the SEI layer capacitance, and \(Z_W\) is the Warburg diffusion impedance. The EIS spectra for the three process groups revealed clear differences. The lifepo4 battery cells from Process 3 displayed the smallest semicircle diameter in the mid-frequency region, indicating the lowest combined Rₛₑᵢ and Rₜ. This suggests a more conductive and stable interface with faster charge transfer kinetics. Conversely, the lifepo4 battery cells from Process 1 showed the largest semicircle, signifying a more resistive and potentially less uniform SEI layer. The low-frequency Warburg region slope was also steeper for Process 3 cells, indicating more favorable solid-state lithium-ion diffusion. These EIS findings provide direct electrochemical evidence supporting the hypothesis that high-SOC aging promotes the formation of a superior SEI in a lifepo4 battery, which in turn reduces parasitic currents (self-discharge) and improves overall cell kinetics and stability.
The integration of all these analyses leads to a coherent understanding of the optimal formation strategy for a lifepo4 battery. Process 3, which involves a full charge to 100% SOC followed by a 10-day aging period before final conditioning to 30% SOC, emerged as the most effective. This protocol forces the lifepo4 battery cell to establish a complete and stable SEI layer under the thermodynamic driving force of a high voltage (high SOC). The subsequent voltage drop during screening is thus more representative of true, inherent self-discharge defects rather than ongoing SEI formation or relaxation processes. The K-value screening applied after this process is therefore highly accurate and reliable, with no late-emerging self-discharge cells. This has profound implications for the manufacturing yield and field performance of lifepo4 battery packs. By implementing Process 3, manufacturers can confidently screen out defective cells early, ensuring that only consistent and reliable lifepo4 battery units are assembled into modules.
In conclusion, this detailed investigation underscores the critical link between formation process engineering and self-discharge screening efficacy for lifepo4 battery technology. The key to accurate screening lies not just in the measurement method but in preconditioning the lifepo4 battery to a state of thermodynamic equilibrium where the SEI is fully formed and stable. Processes involving aging at high SOC (70-100%) achieve this, leading to lower initial coulombic efficiency but far superior long-term voltage stability, capacity retention, cycle life, and consistent self-discharge behavior. The K-value method, when applied after such a stabilizing formation process, becomes a powerful and reliable tool for quality assurance. For the sustainable advancement of electric vehicles and grid storage, optimizing the formation process of every lifepo4 battery is a non-negotiable step toward achieving the safety, longevity, and performance that the market demands. Future work may explore the precise chemical composition and morphology of the SEI formed under these different conditions using advanced analytical techniques, further refining our understanding of the ideal lifepo4 battery formation protocol.