
In the modern landscape of power supply, microgrids have emerged as a pivotal technology for distributed generation systems. By integrating distributed generation sources, loads, energy storage, and protection/automation devices, they maximize the utilization of renewable energy and mitigate its intermittency’s impact on the main grid. A key challenge is enhancing power supply reliability and quality while ensuring economic viability. Concurrently, the rapid global proliferation of electric vehicles has led to a growing stockpile of decommissioned power batteries. Exploring their secondary use, particularly in stationary energy storage applications, presents a significant opportunity for resource efficiency and cost reduction.
This article details the design, implementation, and, most importantly, a comprehensive year-long operational analysis of a grid-connected photovoltaic and energy storage system (PV-ESS) microgrid, with a specific focus on utilizing decommissioned LiFePO4 batteries. The system was constructed to serve the actual load of an office building, coupling a photovoltaic array with an energy storage system based on both new and retired LiFePO4 battery packs. The primary objective was to validate the technical and economic feasibility of integrating second-life LiFePO4 batteries into a functional microgrid, thereby demonstrating a practical pathway for their cascaded use and contributing to broader sustainability goals.
1. System Configuration and Architecture
The experimental microgrid platform was established within an office park. Its core components include the photovoltaic generation system, the hybrid energy storage system (combining new and decommissioned LiFePO4 batteries), an energy management system (EMS), and a time-of-use (TOU) based control strategy.
1.1 Photovoltaic Generation System
The PV system consists of 508 units of 270 Wp polycrystalline silicon solar modules, deployed on building rooftops, resulting in a total installed capacity of 137.16 kWp. The arrays are configured considering the local geographical position and annual solar irradiance, with modules connected in series and parallel combinations. The generated DC power is fed into the user-side 0.38 kV AC bus via multiple grid-tied string inverters (including units of 10 kW and 36 kW capacity). A dedicated energy meter is installed to accurately measure the total PV energy yield.
1.2 Hybrid Energy Storage System (ESS)
The heart of this project is the hybrid ESS. It integrates two distinct battery banks:
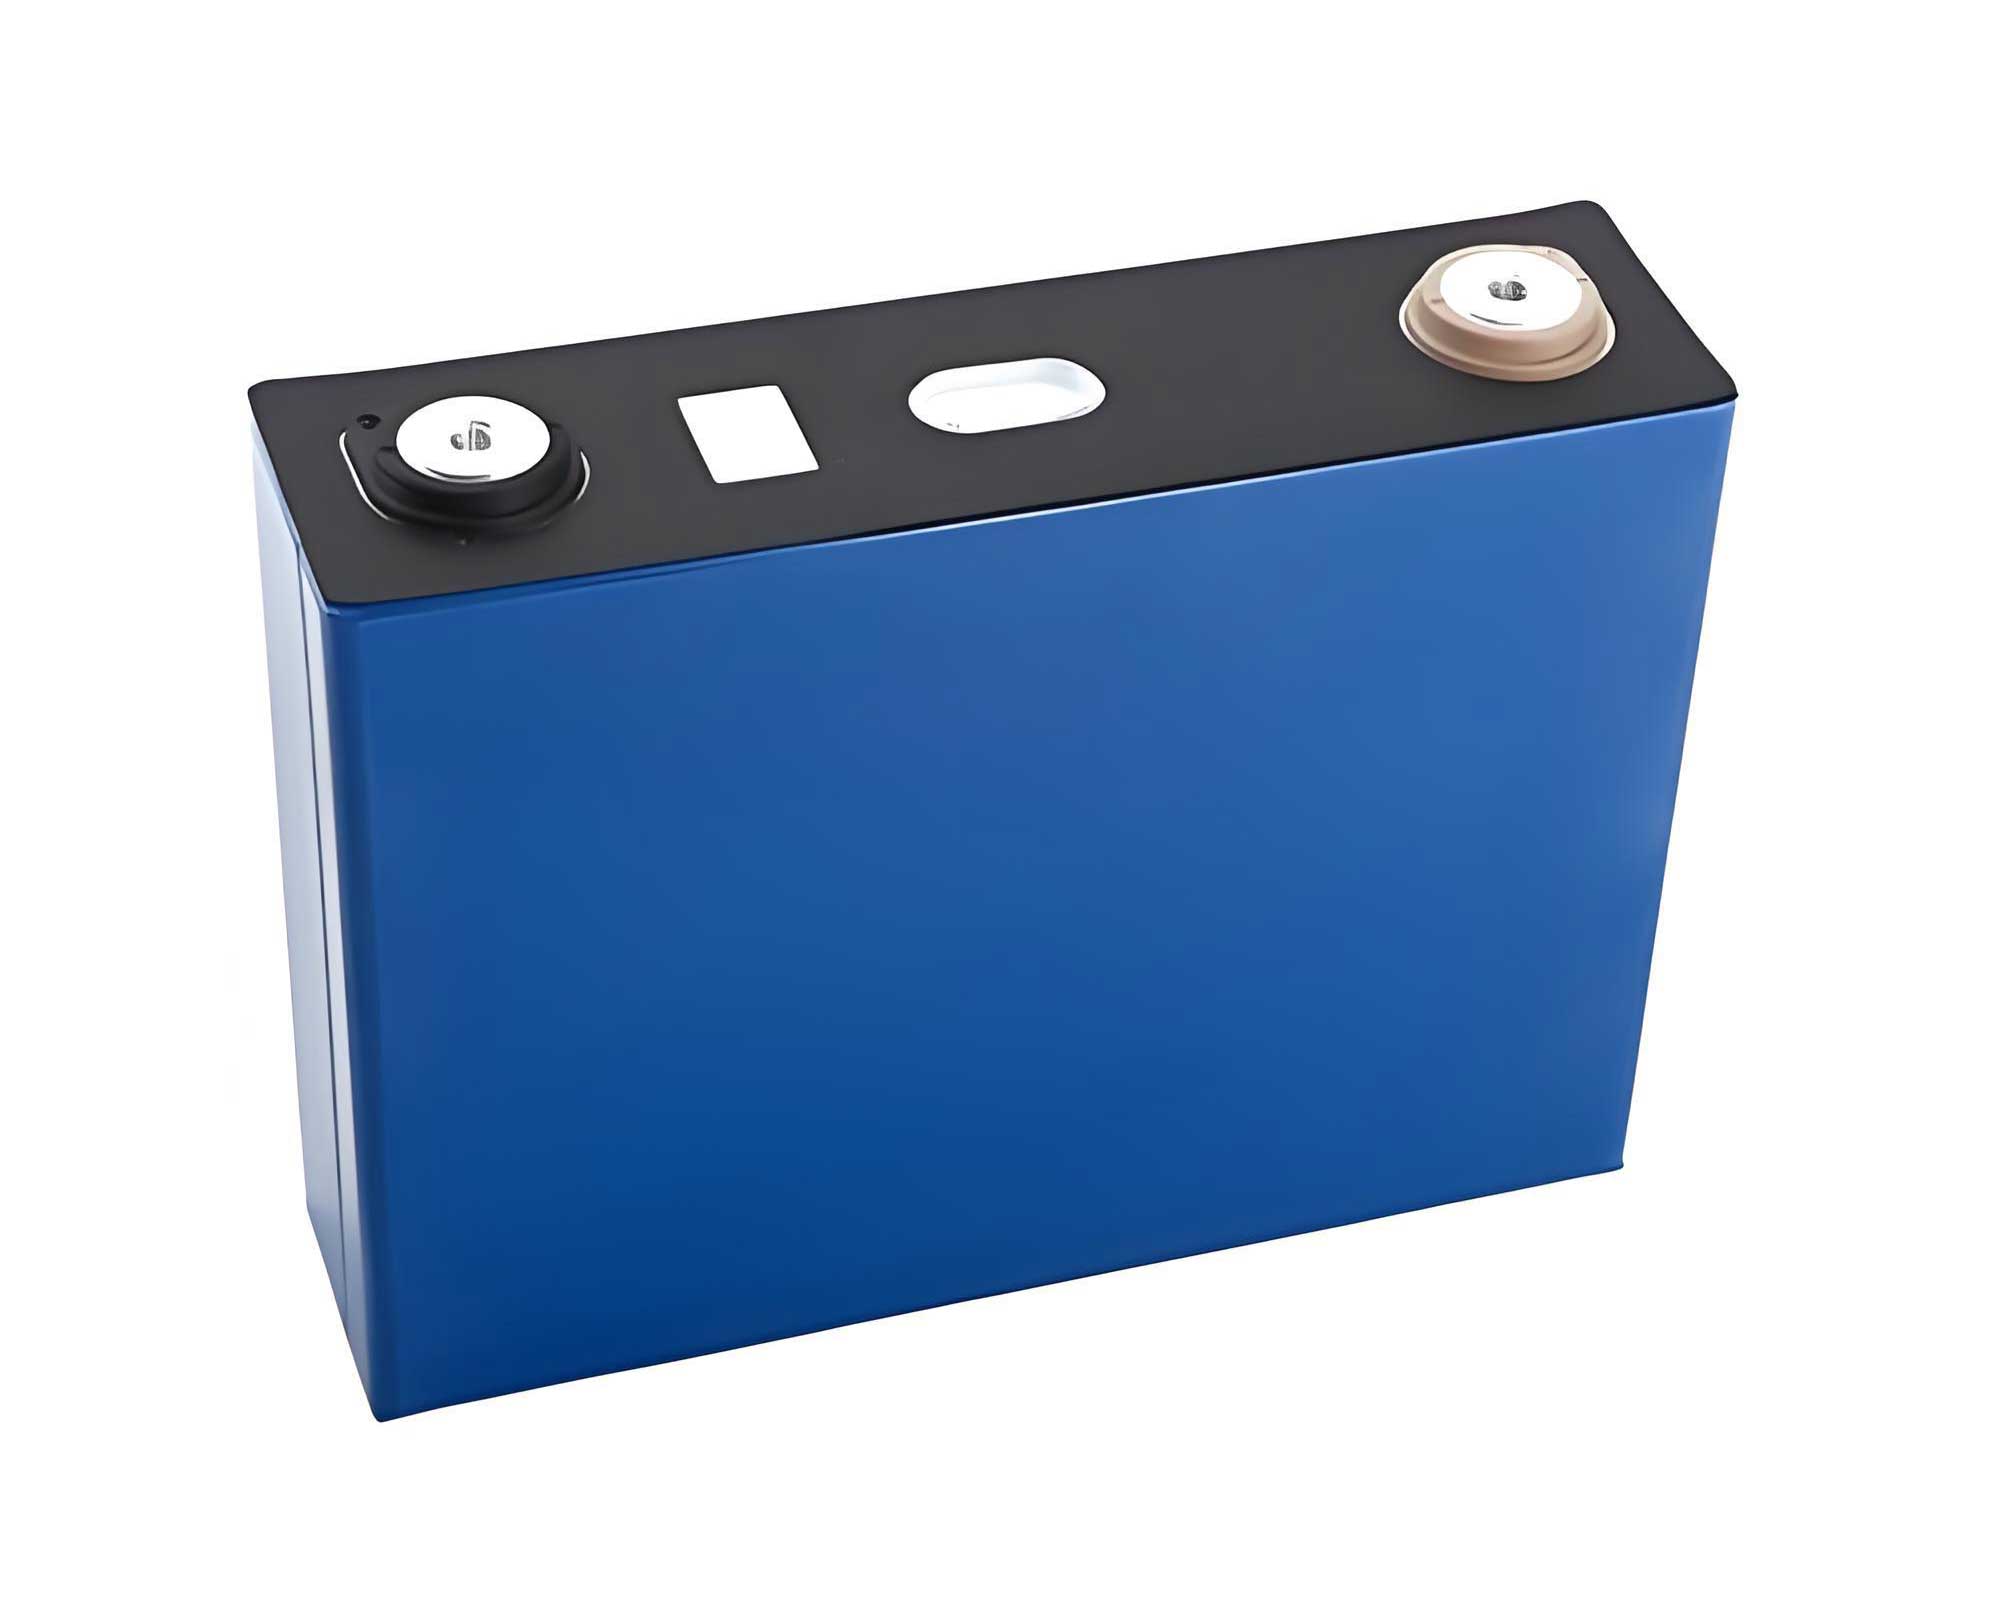
- New LiFePO4 Battery Bank: Comprising 8 series-connected new battery packs.
- Decommissioned LiFePO4 Battery Bank: Comprising 17 series-connected retired power battery packs, which underwent screening and regrouping.
The key parameters of these battery packs are summarized in Table 1.
| Parameter | New LiFePO4 Battery Pack | Decommissioned LiFePO4 Battery Pack |
|---|---|---|
| Configuration | 12 series modules with BMU | 8 series modules with BMU |
| Rated Capacity (Ah) | 216 | 165* |
| Rated Voltage (V) | 38.4 | 25.6 |
| Rated Energy (kWh) | 8.2944 | 4.224 |
*Capacity verified post-screening, with SOC=100% defined at 165Ah.
The new battery bank (8 packs in series) forms a system with a voltage of 307.2V and energy of 66.352 kWh. The decommissioned LiFePO4 battery bank (17 packs in series) forms a system with a voltage of 435.2V and energy of 71.808 kWh. Each bank is connected to a dedicated 18 kW bi-directional power conversion system (PCS). Thus, the two units together constitute the complete ESS with a total power rating of 36 kW and a total energy capacity of 138.16 kWh. The ESS is connected in parallel with the PV system at the user-side 0.38 kV AC bus to serve the building loads cooperatively.
1.3 Energy Management System (EMS) & Control Strategy
The microgrid is governed by a centralized Energy Management System. The upper-level is a workstation hosting the EMS software platform, responsible for data acquisition, storage, analysis, visualization, and executing control mode switches. The lower-level comprises communication gateways that collect data from all subsystems (Battery Management Systems, meters, inverters, PCS, environmental sensors) and transmit it to the EMS via a dedicated network.
The operational strategy is designed around the local TOU electricity tariff structure, detailed in Table 2. The goal is to minimize energy cost by maximizing PV self-consumption and performing energy arbitrage.
| Season | Months | Period | Time | Price (USD/kWh)* |
|---|---|---|---|---|
| Summer | Jul, Aug, Sep | Peak | 8:00-11:00, 13:00-15:00, 18:00-21:00 | 0.175 |
| Flat | 6:00-8:00, 11:00-13:00, 15:00-18:00, 21:00-22:00 | 0.115 | ||
| Off-Peak | 22:00 – Next 6:00 | 0.055 | ||
| Non-Summer | All Other Months | Peak | 8:00-11:00, 18:00-21:00 | 0.165 |
| Flat | 6:00-8:00, 11:00-18:00, 21:00-22:00 | 0.110 | ||
| Off-Peak | 22:00 – Next 6:00 | 0.050 |
*Prices are approximate conversions for illustrative purposes.
The core logic of the time-scheduled control strategy is based on the real-time relationship between load demand \(P_{load}(t)\), PV output \(P_{pv}(t)\), and ESS output \(P_{ess}(t)\). The strategy is outlined in Table 3.
| Period | Condition | Operating Mode |
|---|---|---|
| Peak | \(P_{load} \leq P_{pv}\) | PV supplies load; surplus feeds to grid. |
| \(P_{pv} < P_{load} \leq P_{pv} + P_{ess,max}\) | PV supplies load primarily, ESS supplements. | |
| \(P_{load} > P_{pv} + P_{ess,max}\) | ESS and PV supply load; grid makes up deficit. | |
| Flat | \(P_{load} \leq P_{pv}\) | PV supplies load; surplus feeds to grid. |
| \(P_{load} > P_{pv}\) | PV supplies load primarily, grid supplements. ESS typically idle. | |
| Off-Peak | \(P_{load} \leq P_{pv}\) | ESS charges from grid. PV supplies load; surplus feeds to grid. |
| \(P_{load} > P_{pv}\) | ESS charges from grid. PV supplies load; grid supplements load. |
2. Annual Operational Performance Analysis
The system operated continuously for a full calendar year. Data collected by the EMS was analyzed to evaluate performance across four key areas: storage system behavior, PV-ESS coordinated operation, system energy flows, and economic benefits.
2.1 Energy Storage System Operational Characteristics
Analysis of data from the final operational day of the year provides insights into the condition of both battery banks after 12 months of service. Charging and discharging were controlled at approximately 0.15C and 0.17C rates, respectively.
New LiFePO4 Battery Bank: The charge and discharge voltage curves for the 8 individual packs were smooth, with minimal voltage fluctuation and very small deviation between packs. This indicates excellent state-of-health consistency among the new LiFePO4 battery packs after one year of operation.
Decommissioned LiFePO4 Battery Bank: The 17 retired packs showed slightly more pronounced voltage fluctuations during cycles compared to the new ones, a phenomenon attributable to inherent aging and variability. However, the overall trajectory and trends of the charge/discharge curves remained consistent and stable. The deviation between packs was manageable, indicating that the screening and regrouping process was effective. The retired LiFePO4 battery bank maintained reasonable operational consistency.
The daily energy efficiency for each bank was calculated. For the new bank, the total charging energy was 59.80 kWh, and the total discharging energy was 56.20 kWh, yielding a daily round-trip efficiency of approximately 94.0%. For the decommissioned LiFePO4 battery bank, the total charging energy was 63.50 kWh, and discharging was 61.10 kWh, yielding a daily efficiency of approximately 96.2%. The formula for calculating daily energy efficiency \(\eta_{daily}\) is:
$$
\eta_{daily} = \frac{E_{discharge}}{E_{charge}} \times 100\%
$$
The high efficiency values, particularly for the second-life LiFePO4 batteries, confirm that the overall storage system maintained excellent performance after a year of operation.
2.2 PV-ESS Coordinated Operation & Peak Shaving Analysis
To understand seasonal and weather-dependent behaviors, six typical days were selected from the annual dataset, as detailed in Table 4.
| Typical Day | Date | Season | Weather Condition |
|---|---|---|---|
| 1 | Jan 10 | Winter | Rainy/Overcast |
| 2 | Jan 14 | Winter | Cloudy |
| 3 | Aug 04 | Summer | Rainy/Overcast |
| 4 | Aug 14 | Summer | Sunny |
| 5 | Nov 09 | Transition | Sunny |
| 6 | Nov 24 | Transition | Rainy/Overcast |
The 24-hour profiles of load demand \(P_{load}(t)\), PV output \(P_{pv}(t)\), and ESS power \(P_{ess}(t)\) for these days reveal key patterns:
- PV Output Variability: PV generation is heavily influenced by season, daylight hours, and weather. Cloud cover causes sharp fluctuations. Daily energy yield is highest in summer, lowest in winter, and greater on sunny days than cloudy/rainy days.
- ESS Peak Shaving and Valley Filling: The ESS strictly adhered to the “charge during off-peak, discharge during peak” strategy. Its operation was stable and predictable, unaffected by weather. The coordinated discharge of the ESS alongside PV generation during peak hours effectively reduced power drawn from the grid, demonstrating clear peak-shaving and valley-filling benefits. The synergy between the photovoltaic system and the LiFePO4 battery-based storage is evident.
- Intelligent Coordination: On some peak periods (e.g., sunny afternoons), a distinct drop in ESS discharge power is observed. This occurs when PV output \(P_{pv}(t)\) surpasses the immediate load demand \(P_{load}(t)\). The EMS logic prioritizes direct PV power for the load, reduces ESS output to conserve energy, and exports surplus PV to the grid. This dynamic coordination maximizes self-consumption and grid support.
The fundamental power balance equation governing this coordination is:
$$
P_{load}(t) = P_{pv}(t) + P_{ess}(t) + P_{grid}(t)
$$
where \(P_{grid}(t)\) is positive when importing from the grid and negative when exporting.
2.3 System-Wide Energy Flow Analysis
The annual energy flows were aggregated monthly to provide a macroscopic view of system performance, as illustrated in the statistical charts (conceptually represented below in Table 5).
| Description | Jan | Feb | Mar | Apr | May | Jun | Jul | Aug | Sep | Oct | Nov | Dec | Annual Total |
|---|---|---|---|---|---|---|---|---|---|---|---|---|---|
| Load Supply by PV (kWh) | ~2,100 | ~1,800 | ~5,500 | ~8,400 | ~7,800 | ~6,900 | ~6,500 | ~10,100 | ~8,200 | ~7,100 | ~4,900 | ~3,200 | 105,980 |
| Load Supply by ESS (kWh) | ~540 | ~480 | ~1,100 | ~1,300 | ~1,500 | ~1,400 | ~2,150 | ~1,800 | ~850 | ~1,200 | ~1,050 | ~650 | 28,550 |
| Load Supply by Grid (kWh) | ~17,360 | ~15,720 | ~13,400 | ~10,300 | ~10,700 | ~11,700 | ~11,350 | ~8,100 | ~11,950 | ~11,700 | ~14,050 | ~16,170 | 247,660 |
| PV to Grid (kWh) | ~3,100 | ~2,700 | ~5,800 | ~13,800 | ~10,500 | ~7,500 | ~4,500 | ~6,200 | ~310 | ~5,200 | ~3,500 | ~2,800 | 50,900 |
| Grid to ESS (Charging) (kWh) | ~620 | ~570 | ~1,250 | ~1,480 | ~1,700 | ~1,550 | ~2,350 | ~2,040 | ~950 | ~1,380 | ~1,180 | ~720 | 34,040 |
Key Insights from Energy Flow Analysis:
- Renewable Penetration: The combined monthly supply from PV and ESS to the load ranged from 21% to 62% of total load, with an annual average of approximately 40%. This demonstrates significant on-site renewable energy consumption and effective peak shaving.
- PV Utilization: The system consistently exported PV surplus to the grid, with a monthly average of about 4.24 MWh. This confirms zero “curtailment” and highlights the additional revenue stream from grid feed-in. The annual PV self-consumption rate can be calculated as:
$$
\text{PV Self-Consumption Rate} = \frac{E_{PV,load}}{E_{PV,load} + E_{PV,grid}} = \frac{105.98}{105.98+50.90} \approx 67.6\%
$$ - ESS Annual Efficiency: Comparing total annual ESS discharge (28.55 MWh) to total annual charge (34.04 MWh) gives a system-wide annual AC-AC round-trip efficiency of approximately 84%. This accounts for PCS losses, battery internal losses, and auxiliary consumption, indicating robust overall storage system performance. The stability of the decommissioned LiFePO4 battery bank is a major contributor to this result.
2.4 Economic Benefit Assessment
Based on the annual energy data and the applicable tariffs, the microgrid’s direct financial benefits were quantified:
- Energy Arbitrage Savings: By charging the LiFePO4 battery-based ESS with low-cost off-peak grid power and discharging it to offset high-cost peak power consumption, the system achieved annual cost savings of approximately $33,000.
- PV Self-Consumption Savings: The 105.98 MWh of PV energy consumed directly on-site offset grid purchases, resulting in savings of approximately $121,000 (using the weighted average retail electricity rate).
- PV Feed-in Revenue: The 50.90 MWh of surplus PV energy exported to the grid generated revenue of approximately $30,000 (based on a feed-in tariff).
Therefore, the total annual direct economic benefit from the grid-connected PV-ESS microgrid sums to approximately $184,000. This compelling figure underscores the financial viability of such systems, significantly enhanced by the use of cost-effective decommissioned LiFePO4 batteries in the storage component. A simplified annual savings formula can be expressed as:
$$
S_{annual} = (E_{ess, discharge} \cdot \Delta p_{arbitrage}) + (E_{pv, load} \cdot p_{retail}) + (E_{pv, grid} \cdot p_{feed-in})
$$
where \(\Delta p_{arbitrage}\) is the average price difference between peak and off-peak periods.
3. Conclusions and Implications
This one-year operational study of a grid-connected PV-ESS microgrid incorporating decommissioned LiFePO4 batteries yields several definitive conclusions:
- Technical Feasibility of Second-Life LiFePO4 Batteries: The retired LiFePO4 battery pack, after careful screening and regrouping, operated stably and consistently alongside new batteries for an entire year. Its daily energy efficiency remained above 96%, and it effectively participated in daily charge-discharge cycles. This proves the technical viability and reliability of decommissioned LiFePO4 batteries for stationary energy storage applications within microgrids, validating their potential for cascaded use.
- Effective Coordinated Operation: The microgrid’s EMS successfully orchestrated the dynamic interplay between PV generation, battery storage, and grid interaction. The system demonstrated clear peak-shaving and valley-filling capabilities, significantly reducing grid power draw during expensive peak periods. The performance was robust across different seasons and weather conditions.
- Significant Energy and Economic Benefits: The system achieved an average 40% renewable supply to the load monthly, with zero PV curtailment. The direct annual economic benefits exceeded $180,000, derived from energy arbitrage, reduced grid consumption, and feed-in revenue. This underscores the strong economic case for such hybrid systems, which is further improved by the lower capital cost associated with second-life LiFePO4 batteries.
- Environmental Contribution: By enhancing the consumption of local solar power and reducing reliance on peak grid power (often generated by less efficient, carbon-intensive plants), the system contributes materially to carbon emission reductions. Extending the useful life of EV batteries through this secondary application also promotes a circular economy, delaying recycling and conserving resources.
In summary, this practical implementation and detailed annual analysis provide strong evidence that integrating decommissioned LiFePO4 batteries into grid-connected commercial PV-ESS microgrids is a technically sound, economically attractive, and environmentally responsible strategy. It offers a replicable model for reducing energy costs, enhancing grid stability, and achieving sustainability goals, while concurrently addressing the growing challenge of managing end-of-life electric vehicle batteries. The success of this project paves the way for broader adoption and further optimization of second-life battery applications in distributed energy systems.