
As an observer of the financial markets, I have been closely monitoring the energy transition theme, particularly the solar panel industry. Since the beginning of 2023, the performance of the new energy sector has been relatively weak, with the solar panel index declining approximately 14%, underperforming major broad-based indices such as the SSE 50, CSI 300, and ChiNext. This underperformance has sparked significant debate and pessimism among investors. However, a deeper analysis reveals that the current valuation of the solar panel sector resides at a historical trough, and excessive pessimism may be unwarranted. This article will explore the underlying dynamics, long-term growth drivers, technological advancements, and competitive landscapes that position solar panel investments for potential recovery and sustained growth.
The apparent weakness stems from two primary factors. First, there is a notable phenomenon of capital rotation within a存量资金博弈 (stock game) environment, where funds are being diverted from sectors like solar panels to other perceived opportunities, creating a “blood-drawing” effect on the sector. Second, the market is rife with concerns: overcapacity leading to intense price competition, fears of decelerating demand growth and subsequent profit declines, and rising trade protectionism in key overseas markets. Objectively, the solar panel industry, after experiencing explosive demand, massive capital inflows, and rapid capacity expansion, has indeed entered a phase of more intense competition. We are likely to witness frequent shuffling and优胜劣汰 (survival of the fittest) among companies. Yet, it is crucial to distinguish this phase from the cyclical peaks of traditional industries. The fundamental growth narrative for solar panels remains intact, and leading integrated players are poised to demonstrate resilience that likely surpasses the market’s current grim expectations.
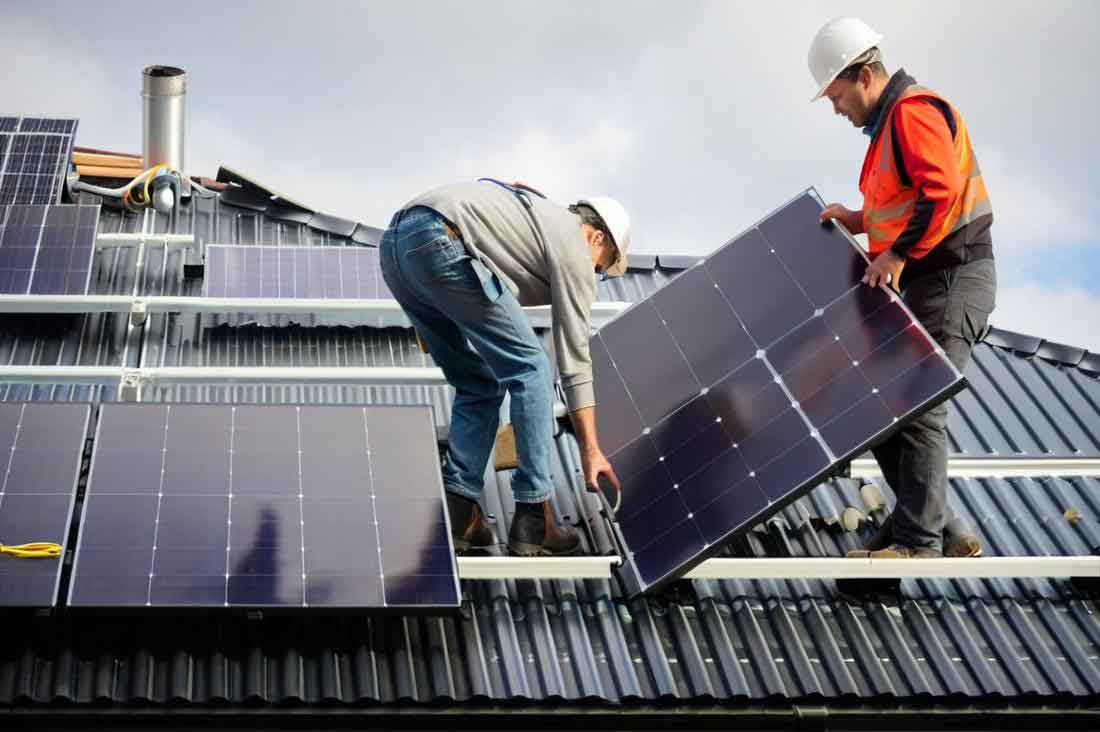
The core growth engine for solar panel adoption has not altered. Demand potential remains substantial, driven by two unwavering forces: the improving economics and accessibility of solar power, and strong policy support for energy transition globally. Major economies like the United States, China, and the European Union continue to reinforce their commitments to clean energy. Public awareness and acceptance of distributed solar panel products are steadily increasing. Furthermore, emerging markets in the Middle East and Africa are beginning to contribute meaningfully to volume growth. To quantify the opportunity, consider that in 2022, electricity generated from solar panels accounted for merely 6.2% of global total electricity generation. This clearly indicates that the industry is far from reaching its saturation point.
The recent downturn in upstream supply chain prices, particularly for polysilicon, has significantly improved the internal rate of return (IRR) for solar panel projects. This makes solar power increasingly competitive against conventional sources. We can model the expected growth. If we let \( G_t \) represent global annual solar panel新增装机 (new installations) in year \( t \), and assume a compound annual growth rate (CAGR), the projection for the next five years can be expressed as:
$$ G_{t+n} = G_t \times (1 + r)^n $$
Where \( r \) is the estimated annual growth rate. Based on current trajectories, a CAGR (\( r \)) of around 20% for the next five years is a reasonable and anticipated figure. This translates to a near doubling of installation volumes within this period. The following table summarizes key demand drivers and their impact:
| Demand Driver | Current Status | Projected Impact on Solar Panel Demand |
|---|---|---|
| Economic Competitiveness (LCOE) | Levelized Cost of Energy (LCOE) for solar panels continues to fall. | High. Lower LCOE accelerates grid parity and adoption. |
| Policy Support (e.g., Inflation Reduction Act, EU Green Deal) | Strong legislative frameworks in place. | High. Provides long-term visibility and subsidies. |
| Distributed Generation (Rooftop Solar Panels) | Growing residential and commercial uptake. | Medium-High. Adds decentralized demand stream. |
| Emerging Market Penetration | Early stages of growth in Africa, Middle East, Southeast Asia. | Medium. Represents a major future growth frontier. |
| Corporate PPAs & RE100 Commitments | Increasing number of corporations procuring renewable energy. | High. Creates large-scale, stable demand for utility-scale solar panel farms. |
A critical differentiating factor for the solar panel industry, compared to other mature or cyclical sectors, is the relentless pace of technological iteration. Companies that first commercialize new technologies reap benefits from cost reductions, efficiency gains, and the structural tightness of advanced capacity, while outdated, inefficient产能 (capacity) is rapidly phased out. History offers clear precedents: the replacement of multicrystalline by monocrystalline silicon solar panels, and the displacement of BSF (Back Surface Field) cells by PERC (Passivated Emitter Rear Cell) technology. Learning from these cycles, today’s leading integrated solar panel manufacturers place paramount importance on maintaining technological and产能先进性 (capacity advancement). They invest heavily in R&D across multiple technology pathways.
The current battleground is in next-generation cell technologies like TOPCon (Tunnel Oxide Passivated Contact), XBC (interdigitated back contact), and HJT (Heterojunction). The manufacturing process for these advanced solar panels is generally more complex than that of the PERC era, involving a higher proportion of proprietary core工艺 (processes). This complexity erects barriers to entry. Leading players, with their deeper technological积累 (accumulation), superior mass-production capabilities, and established channels for new product introduction, hold a distinct competitive edge over second/third-tier players and new entrants. Their量产进度 (mass production progress) is faster and more reliable.
We can express the unit profit advantage from technology leadership. Let \( \pi_{tech} \) represent the unit profit (e.g., per watt) for a solar panel manufacturer. It is a function of technology level \( T \), manufacturing scale \( S \), and cost \( C \).
$$ \pi_{tech} = P(T, S) – C(T, S) $$
Where \( P(T, S) \) is the price achievable (often with a premium for high-efficiency solar panels), and \( C(T, S) \) is the cost. Leaders with advanced \( T \) and optimized \( S \) enjoy lower \( C \) and/or higher \( P \), leading to \( \pi_{tech}^{leader} > \pi_{tech}^{follower} \). In the medium to long term, there remains significant room for cost reduction and efficiency improvement for TOPCon, XBC, and HJT solar panels. Moreover, the commercialization of tandem/t叠层电池 (stacked cells) has begun, which promises another leap in efficiency. I believe leading integrated companies will maintain their先机 (first-mover advantage) throughout this series of iterations, thereby supporting their unit profit margins.
| Technology | Key Characteristics | Current Average Efficiency (Lab/Module) | Potential Efficiency Limit | Primary Challenges |
|---|---|---|---|---|
| PERC (Legacy Dominant) | Mature, low-cost process. | ~22.5% (module) | ~24% | Approaching theoretical limit. |
| TOPCon | High efficiency, good compatibility with existing lines. | ~24.5% (cell) | >28% | Process complexity, upfront capex. |
| HJT | Highest efficiency potential, low-temperature process, bifacial率高. | ~24.8% (cell) | >30% | High capex, sensitive to materials (indium, silver). |
| XBC (e.g., IBC) | Excellent aesthetics, very high efficiency, no front grid shading. | ~24.7% (cell) | >29% | Extremely complex manufacturing, highest capex. |
| Tandem (Perovskite/Si) | Next-generation, can break single-junction Shockley-Queisser limit. | >33% (lab cell) | >40% | Long-term stability, scalable manufacturing. |
Beyond pure technological prowess, leading solar panel manufacturers possess other竞争优势 (competitive advantages) that are difficult to replicate quickly. In international operations, high-value markets like Europe and the United States impose stringent requirements on a company’s bankability, brand reputation, channel relationships, after-sales service, supply chain management, and compliance (e.g., with traceability or forced labor regulations). Most firms currently operating successfully in these overseas markets are seasoned veterans who have navigated multiple industry cycles. New entrants cannot easily disrupt these markets through low-price competition alone. For top players, overseas markets can contribute over 70% to their利润贡献 (profit contribution), forming a relatively stable盈利基本盘 (profit foundation).
Additionally, leaders often enjoy advantages in production and manufacturing costs, supply chain management (securing better terms for silicon wafers, glass, etc.), and brand-driven sales premiums. These factors can collectively contribute an excess profit of at least several cents per watt for their solar panels. Therefore, even as polysilicon prices decrease—which reduces input costs for everyone—I maintain a relatively optimistic view that integrated leaders can preserve healthy profit margins. The margin resilience can be illustrated by a simple model. The gross margin \( M \) for a solar panel maker is:
$$ M = \frac{P_{module} – C_{total}}{P_{module}} \times 100\% $$
$$ C_{total} = C_{polysilicon} + C_{non-polysilicon\_BOS} + C_{manufacturing} + C_{SG\&A} $$
When \( C_{polysilicon} \) falls, \( C_{total} \) decreases. For a leader with strong pricing power \( P_{module} \) and lower \( C_{non-polysilicon\_BOS} \) & \( C_{manufacturing} \) due to scale and expertise, the margin \( M \) can remain stable or even expand if the price decline is passed through to stimulate more demand for solar panels.
Now, let’s examine the valuation perspective, which is the most compelling part of the current thesis. The solar panel sector’s current price-to-earnings ratio on a trailing twelve-month (PE-TTM) basis is approximately 16.6x. This places it at about the 0.6th percentile of its valuation range over the past five years. To put this in context, the average rolling PE for the broader manufacturing sector is around 24.8x. This significant discount indicates that the market has already priced in a substantial portion, if not all, of the pessimistic scenarios discussed earlier. The following table compares valuation metrics:
| Metric | Solar Panel Sector (Current) | Solar Panel Sector (5-Year Avg) | Broad Manufacturing Sector (Current) | Implied Conclusion |
|---|---|---|---|---|
| PE-TTM | ~16.6x | ~28.4x (Estimated Avg) | ~24.8x | Deep undervaluation relative to own history and peers. |
| PE Percentile (5-Yr) | 0.6% | 50% (Median) | N/A | Virtually at historical lows. |
| Price-to-Book (PB) | ~2.1x (Estimated) | ~3.5x (Estimated) | ~2.8x (Estimated) | Trading below historical and sector book value multiples. |
| Dividend Yield | Increasing as profits are distributed | Historically Lower | Comparable | Income support emerging. |
This valuation disconnect creates a potentially attractive entry point. In the short term, terminal demand for solar panels is expected to accelerate once polysilicon prices truly bottom out and stabilize. The uncertainty that has caused project delays will diminish, leading to a release of pent-up demand. For integrated companies,盈利兑现 (profit realization) in the coming quarters could well exceed the currently depressed market expectations, serving as a positive catalyst.
From a medium-to-long-term viewpoint, the profit expectations and valuation中枢 (center) for high-quality solar panel companies have room for修复 (repair or re-rating). The investment性价比 (cost-performance ratio) at current levels appears high. The potential upside can be framed using a basic valuation adjustment model. If the sector’s earnings (E) grow at a rate \( g \) and its PE multiple expands from the current depressed level \( PE_{current} \) to a more normalized level \( PE_{normal} \), the total price appreciation potential \( A \) over \( n \) years can be approximated as:
$$ A = (1 + g)^n \times \frac{PE_{normal}}{PE_{current}} – 1 $$
For instance, if \( g = 15\% \) annually for earnings, \( n = 3 \) years, \( PE_{current} = 16.6x \), and \( PE_{normal} = 22.0x \) (still below historical average), then:
$$ A = (1.15)^3 \times \frac{22.0}{16.6} – 1 \approx 1.5209 \times 1.3253 – 1 \approx 2.016 – 1 = 1.016 $$
This suggests a potential doubling of value (+101.6%) over three years from combined earnings growth and multiple expansion for the solar panel sector—a compelling proposition.
It is also essential to consider risks in a balanced framework. The table below outlines key risks and mitigating factors for solar panel investments:
| Risk Category | Description | Mitigating Factors / Observations |
|---|---|---|
| Overcapacity & Price Wars | Aggressive capacity expansion leads to supply glut, pressuring solar panel prices and margins. | Consolidation is inevitable. Leaders with cost advantages will survive. Demand growth can absorb capacity over time. Current low valuations price in severe scenarios. |
| Trade Barriers | Tariffs, local content rules, and anti-dumping/countervailing duties in key markets (US, EU, India). | Leading firms have global manufacturing footprints (Southeast Asia, US, etc.) to navigate tariffs. Brand and bankability become even more critical in protected markets. |
| Technology Disruption | A new, leapfrogging technology could render existing solar panel产能 obsolete. | Leaders are actively investing across all promising pathways (TOPCon, HJT, Tandem). Their R&D budgets and pilot lines give them a surveillance and adoption advantage. |
| Policy Reversal | Reduction or elimination of government subsidies and support for solar panels. | Grid parity is being reached in more regions, reducing reliance on subsidies. Core policies (EU Green Deal, US IRA) have multi-year political backing. |
| Interest Rate Environment | Higher financing costs reduce the NPV of long-term solar panel projects. | Falling solar panel system costs offset some rate pressure. Solar projects often have lower cost of capital due to stable, predictable cash flows. |
In conclusion, while the solar panel industry is undoubtedly navigating a challenging phase characterized by competition and sentiment headwinds, its long-term fundamentals remain robust. The demand trajectory is supported by irreversible energy transition trends, continuous technological进步 (progress) that rewards innovators, and the consolidation of market share among players with durable competitive moats. The current valuation, languishing at historical lows relative to both its own history and the broader industrial sector, presents a significant margin of safety. For investors with a medium-to-long-term horizon, this period of pessimism represents a compelling opportunity to build positions in high-quality solar panel companies. The potential for demand acceleration, earnings resilience from leaders, and subsequent valuation repair creates a favorable risk-reward asymmetry. Therefore, based on the analysis of growth drivers, technology, competition, and valuation, I believe there is no need for excessive pessimism towards the solar panel sector at this juncture. Strategic patience and selective investment in the best-positioned solar panel manufacturers could yield substantial rewards as the cycle evolves.
To further elaborate on the global demand picture, let’s break down regional solar panel installation forecasts. The growth is not monolithic; it varies by region based on policy, resource, and economic development.
| Region | 2023E New Installations (GW DC) | 2027E Forecast (GW DC) | CAGR (2023-2027E) | Key Growth Drivers |
|---|---|---|---|---|
| China | ~180 | ~250-280 | ~8-12% | Desert mega-bases, distributed generation, national renewable targets. |
| United States | ~30 | ~55-65 | ~16-21% | Inflation Reduction Act incentives, utility procurement, corporate PPAs. |
| European Union | ~55 | ~85-100 | ~11-16% | REPowerEU plan, energy security concerns, high retail electricity prices. |
| India | ~18 | ~35-45 | ~18-25% | National Solar Mission, large-scale tenders, rising electricity demand. |
| Rest of World (RoW) | ~70 | ~130-160 | ~17-23% | Middle East (solar tenders), Southeast Asia, Latin America, Africa. |
| Global Total | ~353 GW | ~555-650 GW | ~12-16% | Aggregation of all regional drivers. |
Note that these installation figures are for solar panel capacity, and the actual energy output depends on the capacity factor. The global CAGR aligns with the earlier 20% estimate when considering a longer horizon and potential upside. The formula for energy output \( E \) from installed solar panel capacity \( C \) is:
$$ E = C \times CF \times h $$
Where \( CF \) is the capacity factor (typically 15-25% for solar panels, depending on location) and \( h \) is the number of hours in a year (8760). So, with 650 GW of solar panels installed by 2027 and an average \( CF \) of 20%, annual electricity generation would be:
$$ E_{2027} = 650 \times 10^9 \, \text{W} \times 0.20 \times 8760 \, \text{h} \approx 1.14 \times 10^{15} \, \text{Wh} = 1,140 \, \text{TWh} $$
This represents a massive increase from current levels, underscoring the growth runway.
Finally, let’s consider the financial profile of a hypothetical leading integrated solar panel company. We can model its income statement sensitivity to key variables like solar panel selling price and volume. This illustrates the operational leverage and margin resilience.
Let:
\( Q \) = Volume of solar panels sold (in MW).
\( P_{avg} \) = Average selling price per watt for solar panels (USD/W).
\( C_{var} \) = Variable cost per watt (including polysilicon, non-polysilicon materials, variable manufacturing).
\( C_{fixed} \) = Fixed costs (SG&A, R&D, fixed manufacturing overhead).
\( Tax \, Rate \) = Effective tax rate.
Then, Net Income \( NI \) is:
$$ NI = [ (P_{avg} – C_{var}) \times Q \times 10^6 – C_{fixed} ] \times (1 – Tax\,Rate) $$
A sensitivity analysis shows how \( NI \) changes with \( P_{avg} \) and \( Q \). For a leader, \( C_{var} \) is lower than peers, and \( C_{fixed} \) is spread over a larger \( Q \), providing margin stability. As demand (\( Q \)) recovers and prices (\( P_{avg} \)) potentially stabilize after the current downturn, the earnings rebound for such a solar panel producer could be powerful. This mathematical perspective reinforces the investment case at a micro level.
In summary, the convergence of sustained demand growth, relentless innovation, strong competitive barriers for leaders, and historically cheap valuations paints a compelling picture for the solar panel sector. While volatility may persist in the near term, the long-term direction is clear. Solar panels are set to play a dominant role in the future global energy mix, and the companies that manufacture them efficiently and innovatively stand to create significant value. The current market sentiment, reflected in the depressed valuations, likely overlooks this resilient long-term trajectory. Therefore, for investors, this is a time for diligent analysis and measured optimism, not undue pessimism, towards solar panel investments.