
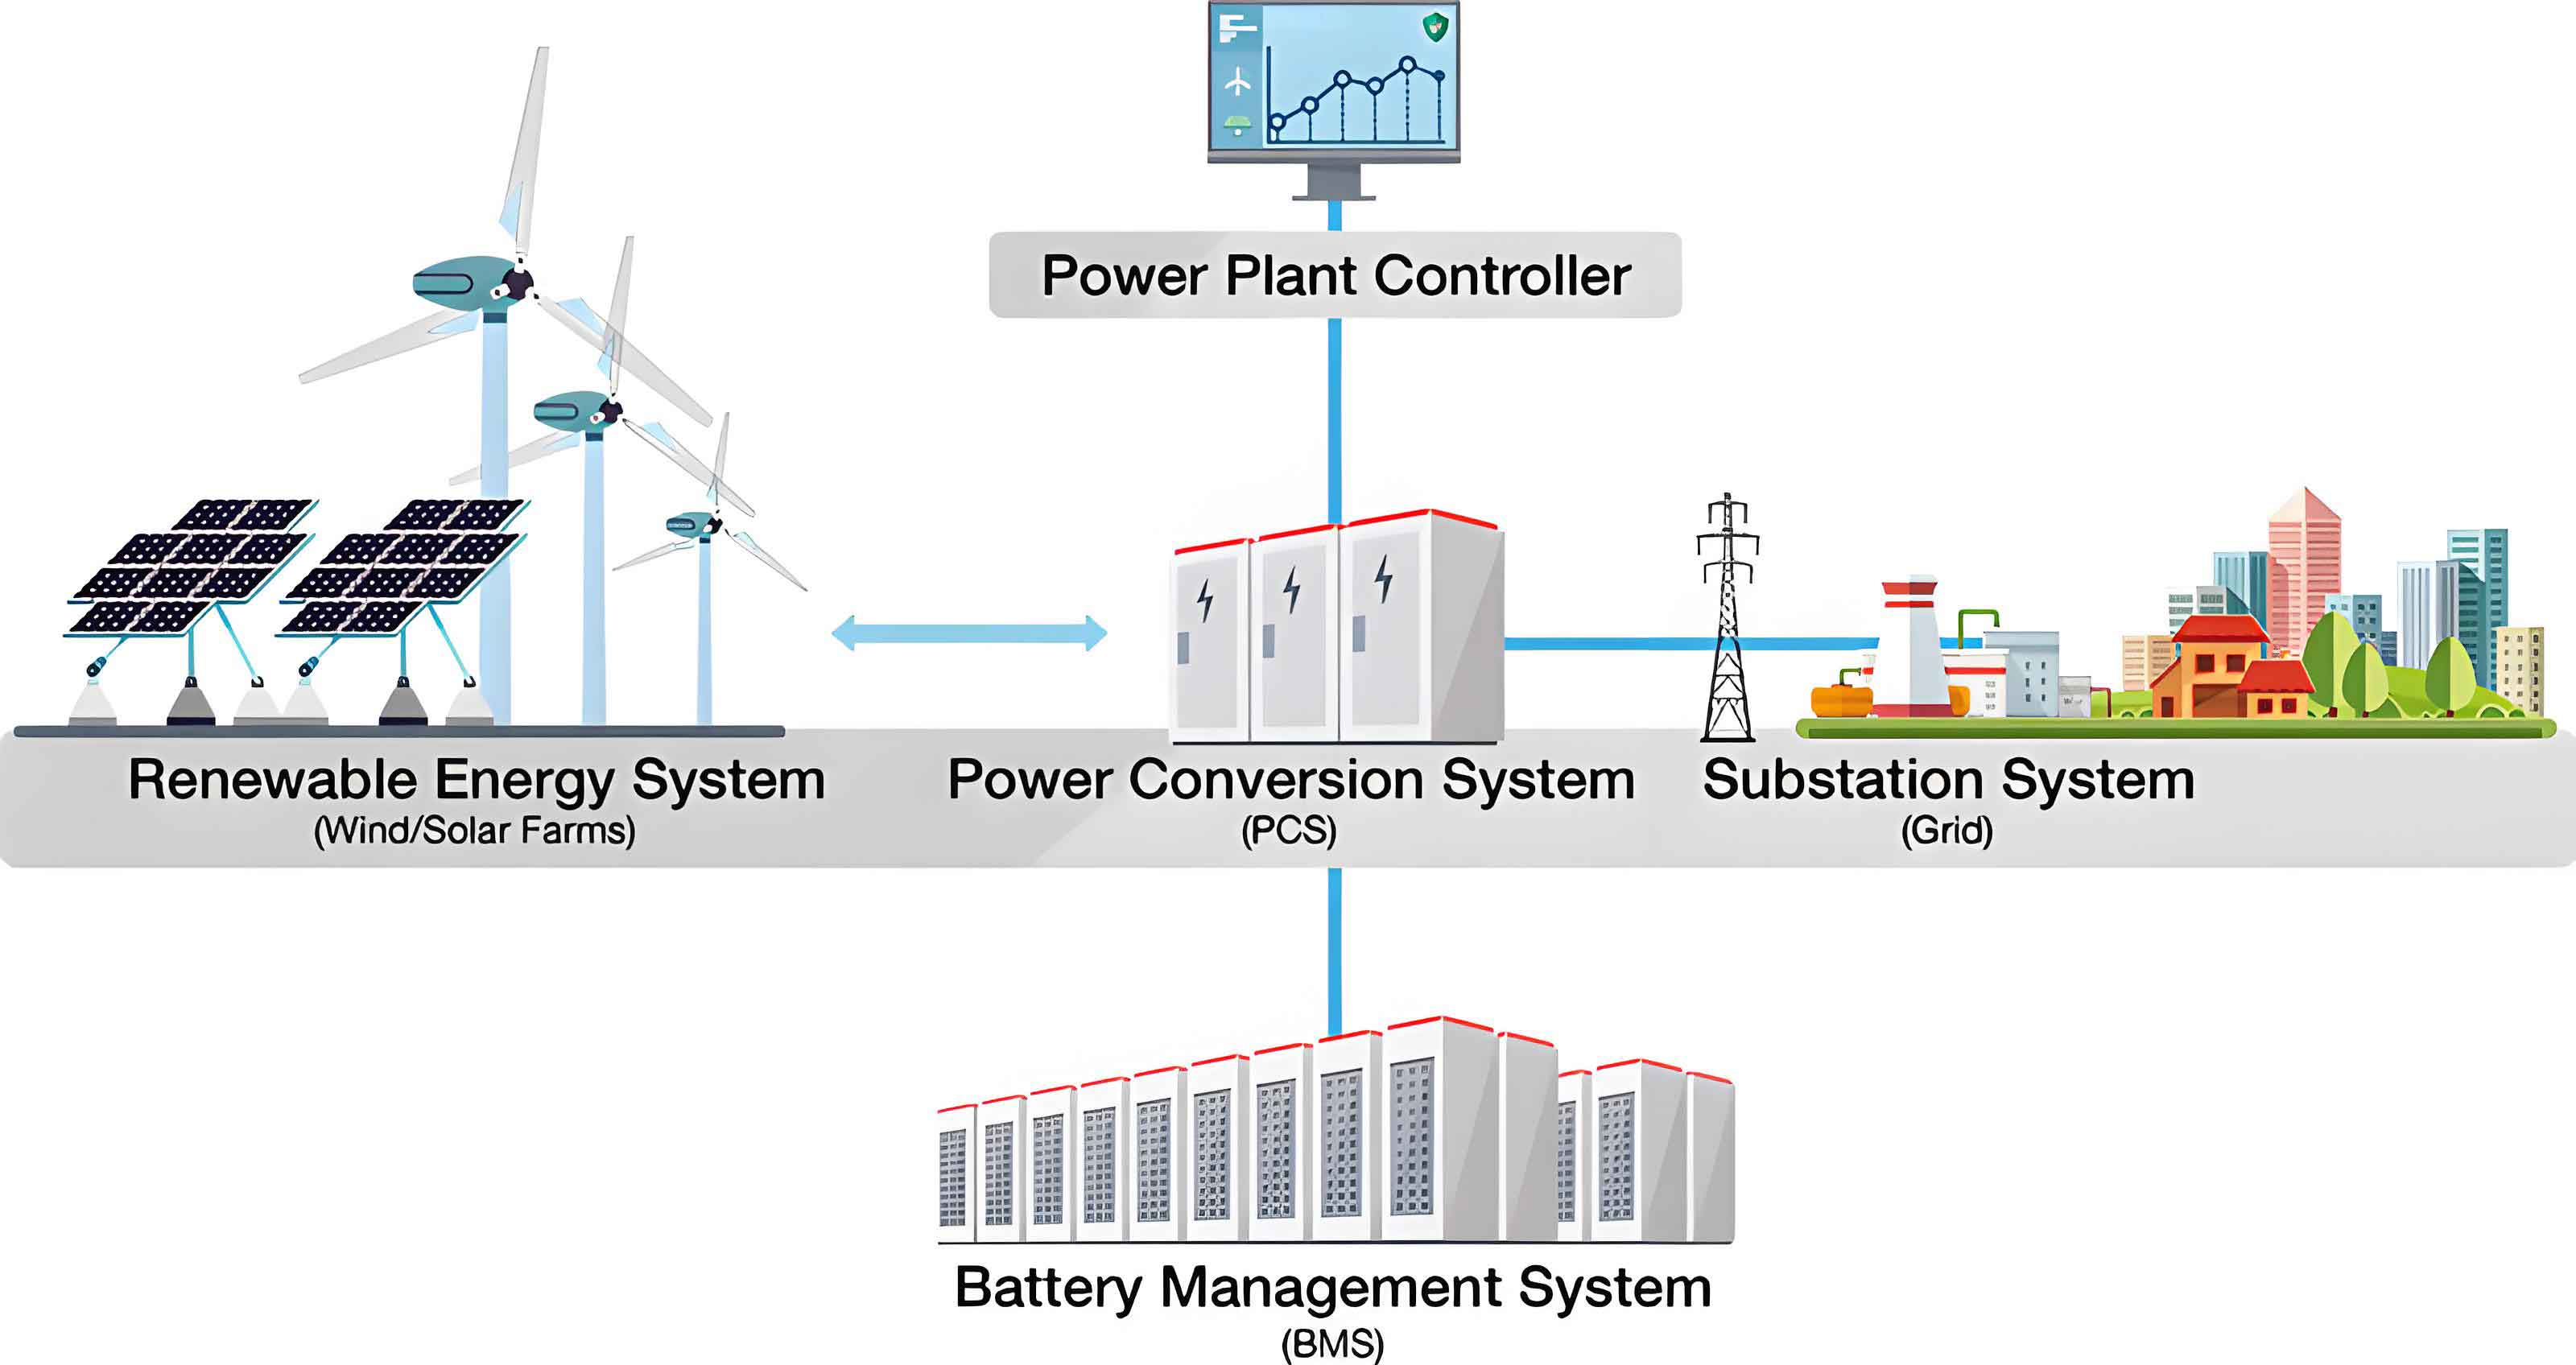
The rapid advancement of battery energy storage systems is pivotal for achieving global energy transition goals. However, this growth is accompanied by significant safety concerns, as evidenced by incidents at large-scale storage facilities. These incidents underscore the urgent need for accurate and comprehensive reliability assessment methods. Traditional approaches often evaluate reliability based on a single degradation metric, such as capacity fade, or assume homogeneity across all battery cells within a system. This simplification fails to capture the complex, multi-dimensional nature of battery aging and the impact of system topology, leading to potentially inaccurate reliability estimates. In our work, we address these limitations by proposing a novel framework for the operational reliability evaluation of battery energy storage systems that explicitly considers multi-dimensional performance degradation.
The core challenge lies in accurately modeling the degradation of individual battery cells, which is influenced by multiple, often coupled, factors. Two of the most critical indicators are capacity and voltage characteristics. While capacity fade is a common endpoint metric, the evolution of voltage profiles during charge/discharge cycles contains rich information about internal electrochemical state changes. Specifically, features extracted from the differential voltage (DV) curve have been shown to correlate strongly with aging mechanisms. Therefore, a robust reliability model for a battery energy storage system must integrate the stochastic degradation processes of both capacity and voltage-derived features across all cells, while also accounting for their interconnection within the system’s topology.
Our proposed methodology is built upon two foundational pillars. First, we develop a data-driven approach to quantify the distribution of voltage characteristics over the battery’s lifecycle using Gaussian Process (GP) regression. Second, we employ a Multi-Dimensional Universal Generating Function (MD-UGF) to integrate the probabilistic descriptions of multiple degradation dimensions for individual cells and subsequently aggregate them according to the system’s series-parallel configuration to evaluate the overall reliability of the battery energy storage system. This integrated approach allows for a more realistic and precise assessment compared to conventional methods.
1. Probabilistic Modeling of Voltage Feature Degradation Using Gaussian Process
The differential voltage analysis is a powerful tool for investigating battery aging. The DV curve, plotted as dV/dQ versus discharge capacity (Q), exhibits peaks corresponding to major phase transitions in the electrode materials. As the battery energy storage system undergoes repeated cycles, the shape of this curve evolves. We focus on a specific voltage feature defined as the distance between two characteristic points on the discharge DV curve: the first plateau point after the initial steep drop and the last plateau point before the final steep drop. This feature, denoted as \(d\), has been observed to monotonically decrease with aging.
However, calculating \(d\) directly from measured data is challenging due to noise and fluctuations in the sampled DV curve. Furthermore, even cells from the same batch exhibit variations, making the feature value for a given cycle non-deterministic. To address this, we propose a Gaussian Process-based method to not only obtain a smooth regression of the DV curve but also to quantify the uncertainty in the derived voltage feature \(d\).
For a given discharge cycle of a cell, we have a set of observations \(\mathcal{D} = \{ \mathbf{X_Q}, \mathbf{Y_{DV}} \}\), where \(\mathbf{X_Q} = [x_{q1}, x_{q2}, …, x_{qn}]^T\) is the vector of discharged capacity sampling points and \(\mathbf{Y_{DV}} = [y_{dv1}, y_{dv2}, …, y_{dvn}]^T\) is the corresponding vector of measured DV values. We model the underlying DV function \(f(x)\) as a Gaussian Process:
$$
f(x) \sim \mathcal{GP}(m(x), k(x, x’))
$$
where \(m(x)\) is the mean function (often set to zero) and \(k(x, x’)\) is the covariance kernel function. We utilize the squared exponential kernel:
$$
k(x_i, x_j) = \sigma_f^2 \exp\left(-\frac{(x_i – x_j)^2}{2l^2}\right)
$$
Here, \(\sigma_f^2\) and \(l\) are hyperparameters representing the signal variance and length-scale, respectively. These hyperparameters are optimized by maximizing the marginal likelihood of the observed data.
The joint prior distribution of the observed values \(\mathbf{Y_{DV}}\) and the predicted function value \(f_*\) at a new input point \(x_*\) is:
$$
\begin{bmatrix}
\mathbf{Y_{DV}} \\
f_*
\end{bmatrix} \sim \mathcal{N}\left(
\mathbf{0},
\begin{bmatrix}
\mathbf{K} & \mathbf{K}_* \\
\mathbf{K}_*^T & k_{**}
\end{bmatrix}
\right)
$$
where \(\mathbf{K}\) is the \(n \times n\) covariance matrix between all training points, \(\mathbf{K}_*\) is the \(n \times 1\) covariance vector between training points and the test point, and \(k_{**} = k(x_*, x_*)\).
Using the properties of conditional Gaussian distributions, the posterior predictive distribution for \(f_*\) is also Gaussian:
$$
f_* | \mathbf{X_Q}, \mathbf{Y_{DV}}, x_* \sim \mathcal{N}(\bar{f}_*, \mathbb{V}[f_*])
$$
with mean and variance given by:
$$
\bar{f}_* = \mathbf{K}_*^T \mathbf{K}^{-1} \mathbf{Y_{DV}}
$$
$$
\mathbb{V}[f_*] = k_{**} – \mathbf{K}_*^T \mathbf{K}^{-1} \mathbf{K}_*
$$
This gives us the complete probabilistic description of the smoothed DV curve. The upper and lower bounds of the confidence interval (e.g., \(\pm M\) standard deviations) are explicit functions:
$$
f_{up}(x) = \bar{f}(x) + M \sqrt{\mathbb{V}[f(x)]}
$$
$$
f_{low}(x) = \bar{f}(x) – M \sqrt{\mathbb{V}[f(x)]}
$$
We then apply a numerical root-finding method (like Newton-Raphson) on the derivatives of \(f_{up}(x)\) and \(f_{low}(x)\) to locate their first and last plateau points, yielding \(x_{up1}, x_{up2}, x_{low1}, x_{low2}\). The voltage feature values at these bounds are \(d_{up} = x_{up2} – x_{up1}\) and \(d_{low} = x_{low2} – x_{low1}\). Assuming the feature is normally distributed within this confidence band, we estimate its mean \(\mu_d\) and standard deviation \(\sigma_d\) for that cycle as:
$$
\mu_d = \frac{1}{2}(d_{low} + d_{up})
$$
$$
\sigma_d = \frac{1}{2M}(d_{up} – d_{low})
$$
Thus, the voltage feature for a cell in a specific cycle is modeled as a random variable \(d^* \sim \mathcal{N}(\mu_d, \sigma_d^2)\). This provides a crucial probabilistic dimension for characterizing cell degradation within the battery energy storage system.
2. Multi-State Reliability Modeling Using the Universal Generating Function
With probabilistic models for both voltage feature degradation (\(d^*\)) and capacity fade (\(Q^* \sim \mathcal{N}(\mu_Q, \sigma_Q^2)\)), we now integrate them to assess the reliability of the battery energy storage system. The Universal Generating Function (UGF) is an effective tool for modeling multi-state systems where components can reside in one of several performance levels with certain probabilities.
2.1 Cell-Level Multi-Dimensional UGF
First, we discretize the continuous distributions of voltage feature and capacity into discrete states. For the voltage feature of cell \(i\), we define \(L_i^v\) states. Each state \(j\) corresponds to an interval \(D_{ij} = [d_{ij}^{lower}, d_{ij}^{upper}]\), ordered from the best state (j=1) to the worst (j=$L_i^v$). The probability of cell \(i\) being in voltage state \(j\) is:
$$
p_{i,j}^d = \int_{d_{ij}^{lower}}^{d_{ij}^{upper}} \frac{1}{\sqrt{2\pi\sigma_d^2}} \exp\left(-\frac{(x – \mu_d)^2}{2\sigma_d^2}\right) dx
$$
The UGF for the voltage feature dimension is:
$$
u_i^d(z) = \sum_{j=1}^{L_i^v} p_{i,j}^d z^{g_j^d}
$$
where \(g_j^d\) is the numerical performance level representing state \(j\), and \(z\) is a dummy variable.
Similarly, for capacity, we define \(M_i^Q\) states with intervals \(I_{ik} = [Q_{ik}^{lower}, Q_{ik}^{upper}]\) and probabilities \(p_{i,k}^Q\). The capacity UGF is:
$$
u_i^Q(z) = \sum_{k=1}^{M_i^Q} p_{i,k}^Q z^{g_k^Q}
$$
A cell fails if either its voltage feature or its capacity falls below their respective minimum required thresholds. To combine the two dimensions, we use a composition operator \(\otimes_{max}\) for the UGFs, which corresponds to taking the worse (higher index) of the two states from each dimension, as failure in either dimension causes cell failure. The combined UGF for cell \(i\) is:
$$
u_i(z) = u_i^d(z) \otimes_{max} u_i^Q(z) = \sum_{j=1}^{L_i^v} \sum_{k=1}^{M_i^Q} p_{i,j}^d p_{i,k}^Q z^{\max(g_j^d, g_k^Q)} = \sum_{e=1}^{E_i} p_{i,e} z^{g_e}
$$
where \(E_i\) is the total number of combined states, \(p_{i,e}\) is the probability of the combined state \(e\), and \(g_e\) is its aggregated performance level. The reliability \(R_i\) of cell \(i\) is the sum of probabilities for all states where its performance level \(g_e\) is better than or equal to a minimum required level \(\gamma\):
$$
R_i = \sum_{e: g_e \leq \gamma} p_{i,e}
$$
2.2 System-Level Reliability Considering Topology
A battery energy storage system is composed of many such cells connected in series and parallel to meet voltage and current requirements. The system’s reliability depends critically on this topology. The UGF framework elegantly handles this through series and parallel composition operators.
For two components (or sub-systems) with UGFs \(u_1(z)=\sum p_{1,h}z^{g_{1,h}}\) and \(u_2(z)=\sum p_{2,m}z^{g_{2,m}}\):
- Series Connection: The system fails if any component fails. The performance level of the series system is determined by the worst (largest index) component. The composition operator is \(\otimes_{max}\):
$$
u_{series}(z) = u_1(z) \otimes_{max} u_2(z) = \sum_h \sum_m p_{1,h} p_{2,m} z^{\max(g_{1,h}, g_{2,m})}
$$
- Parallel Connection: The system can tolerate the failure of some components. The overall performance level is often determined by the best (smallest index) remaining component, especially for capacity. The composition operator is \(\otimes_{min}\):
$$
u_{parallel}(z) = u_1(z) \otimes_{min} u_2(z) = \sum_h \sum_m p_{1,h} p_{2,m} z^{\min(g_{1,h}, g_{2,m})}
$$
For a complex battery energy storage system with \(N\) cells arranged in a specific configuration (e.g., \(S\) cells in series per string, with \(P\) such strings in parallel), we recursively apply these operators according to the physical connections. Starting from individual cell UGFs \(u_i(z)\), we first aggregate cells in series within a string using \(\otimes_{max}\), then aggregate the resulting \(P\) string UGFs in parallel using \(\otimes_{min}\) to obtain the final system UGF \(U_{sys}(z)\):
$$
U_{sys}(z) = \Omega(u_1(z), u_2(z), …, u_N(z)) = \sum_{h=1}^{H} p_{sys,h} z^{G_h}
$$
where \(\Omega\) represents the nested series-parallel composition, \(p_{sys,h}\) is the probability of the entire battery energy storage system being in state \(h\), and \(G_h\) is the corresponding system-level performance index.
The overall reliability \(R_s\) of the battery energy storage system is then the probability that its performance state is acceptable (i.e., \(G_h \leq \beta\), where \(\beta\) is the system-level requirement):
$$
R_s = \sum_{h: G_h \leq \beta} p_{sys,h}
$$
This formulation moves far beyond the traditional, simplistic approach where system reliability is calculated as \(R_s = R_i^N\), which ignores both the multi-state nature of degradation and the system topology.
3. Case Study and Comparative Analysis
To validate our proposed methodology, we conducted simulations using aging data from NASA’s 18650 lithium-ion battery dataset. We considered a battery energy storage system comprising 144 cells. Two configurations were analyzed: a “Series-Parallel” system (12 cells in series per string, 12 strings in parallel) and a “Parallel-Series” system (12 cells in parallel per module, 12 modules in series). Both configurations theoretically provide the same total voltage and capacity. The minimum required system performance state \(\beta\) was set to 9 (out of 13 states, where 13 is total failure). We compared three methods:
M1: Traditional Binary Reliability Method. Assumes a single, average cell reliability and ignores topology (\(R_s = R_{cell}^{144}\)).
M2: Single-Dimension Multi-State Method. Uses the UGF framework but considers only capacity degradation, while accounting for topology.
M3: Proposed Multi-Dimension Multi-State Method. Our full method integrating both voltage feature and capacity degradation using MD-UGF and accounting for topology.
The calculated system reliability \(R_s\) over 1000 charge-discharge cycles for the Series-Parallel configuration is shown in the figure below (conceptual representation based on results). The rapid, unrealistic drop in reliability predicted by M1 around cycle 410 highlights the inaccuracy of traditional models. In contrast, both M2 and M3 show a more gradual and credible decline, with the reliability of the battery energy storage system remaining above the typical safety threshold for a much longer period. M3, however, predicts a slightly earlier complete failure (by ~48 cycles) compared to M2. This is because M3 incorporates the “weakest link” effect from the voltage feature dimension; a cell can be deemed failed if either its capacity OR its voltage feature degrades beyond acceptable limits.
The state probability distribution for the battery energy storage system evaluated using M3 at various cycle counts is summarized in Table 1. This table clearly illustrates the gradual migration of probability mass from healthier states (lower state numbers) to more degraded states (higher state numbers) as cycling progresses, providing a rich, multi-state view of system health that is unavailable from binary models.
| Cycle | State 1 | State 2 | State 3 | State 4 | State 5 | State 6 | State 7 | State 8 | State 9 | State 10 | State 11 | State 12 | State 13 |
|---|---|---|---|---|---|---|---|---|---|---|---|---|---|
| 50 | ~1.000 | < 1e-29 | 0 | 0 | 0 | 0 | 0 | 0 | 0 | 0 | 0 | 0 | 0 |
| 300 | 0 | 0 | < 1e-83 | < 1e-16 | 0.9601 | 0.0039 | < 1e-35 | < 1e-121 | 0 | 0 | 0 | 0 | 0 |
| 600 | 0 | 0 | 0 | < 1e-95 | < 1e-37 | < 1e-09 | 0.2923 | 0.7068 | < 1e-16 | < 1e-51 | < 1e-117 | 0 | 0 |
Impact of System Topology
A key advantage of our UGF-based approach is its ability to differentiate between topologies that are electrically equivalent in terms of nominal ratings. The reliability curves for the Series-Parallel and Parallel-Series configurations, both evaluated using M3, diverge as shown in Table 2. The Series-Parallel configuration consistently demonstrates higher reliability throughout the aging process. This is logically sound: in a series string, the failure of a single cell can drastically reduce the string’s performance, whereas in a parallel module, the failure of one cell has a less severe impact on the module’s output. Therefore, designing a battery energy storage system with more parallel paths (Series-Parallel) generally enhances reliability compared to a topology with longer series strings (Parallel-Series), a critical insight that our method quantitatively reveals.
| Configuration | Reliability Start of Significant Decline (Cycle ~) | Reliability Reaches Zero (Cycle ~) | Interpretation |
|---|---|---|---|
| Series-Parallel (12S12P) | 782 | >950 | Higher overall reliability. Failure of a cell in a string is critical, but multiple strings provide redundancy. |
| Parallel-Series (12P12S) | 770 | ~902 | Lower overall reliability. Failure of a cell in a module is less critical, but failure of a module (series of 12 parallel groups) is severe. |
4. Conclusion
In this work, we have developed and demonstrated a comprehensive framework for the operational reliability evaluation of battery energy storage systems. The methodology addresses two major shortcomings of conventional approaches: the oversimplification of battery degradation to a single metric and the neglect of system topology in reliability aggregation.
The first pillar of our framework employs Gaussian Process regression to extract and probabilistically characterize a voltage-based feature from differential voltage curves. This provides a robust, uncertainty-aware measure of one key degradation dimension. The second pillar integrates this dimension with traditional capacity fade models using the Multi-Dimensional Universal Generating Function. The UGF formalism allows for the natural combination of multiple stochastic degradation processes at the cell level and the precise aggregation of these cell states according to the specific series-parallel connections within the battery energy storage system.
Our case study, based on real-world battery aging data, confirms that the proposed method yields more realistic and conservative reliability estimates compared to traditional binary models or single-dimension multi-state models. Furthermore, it provides valuable quantitative insights into the impact of system architecture, clearly showing that Series-Parallel configurations generally offer superior reliability compared to Parallel-Series ones for equivalent electrical specifications.
This methodology provides a powerful tool for designers, operators, and risk assessors of battery energy storage systems. It enables more informed decisions regarding system design, maintenance scheduling, and end-of-life assessment, ultimately contributing to the safer and more reliable integration of large-scale energy storage into the modern power grid.