
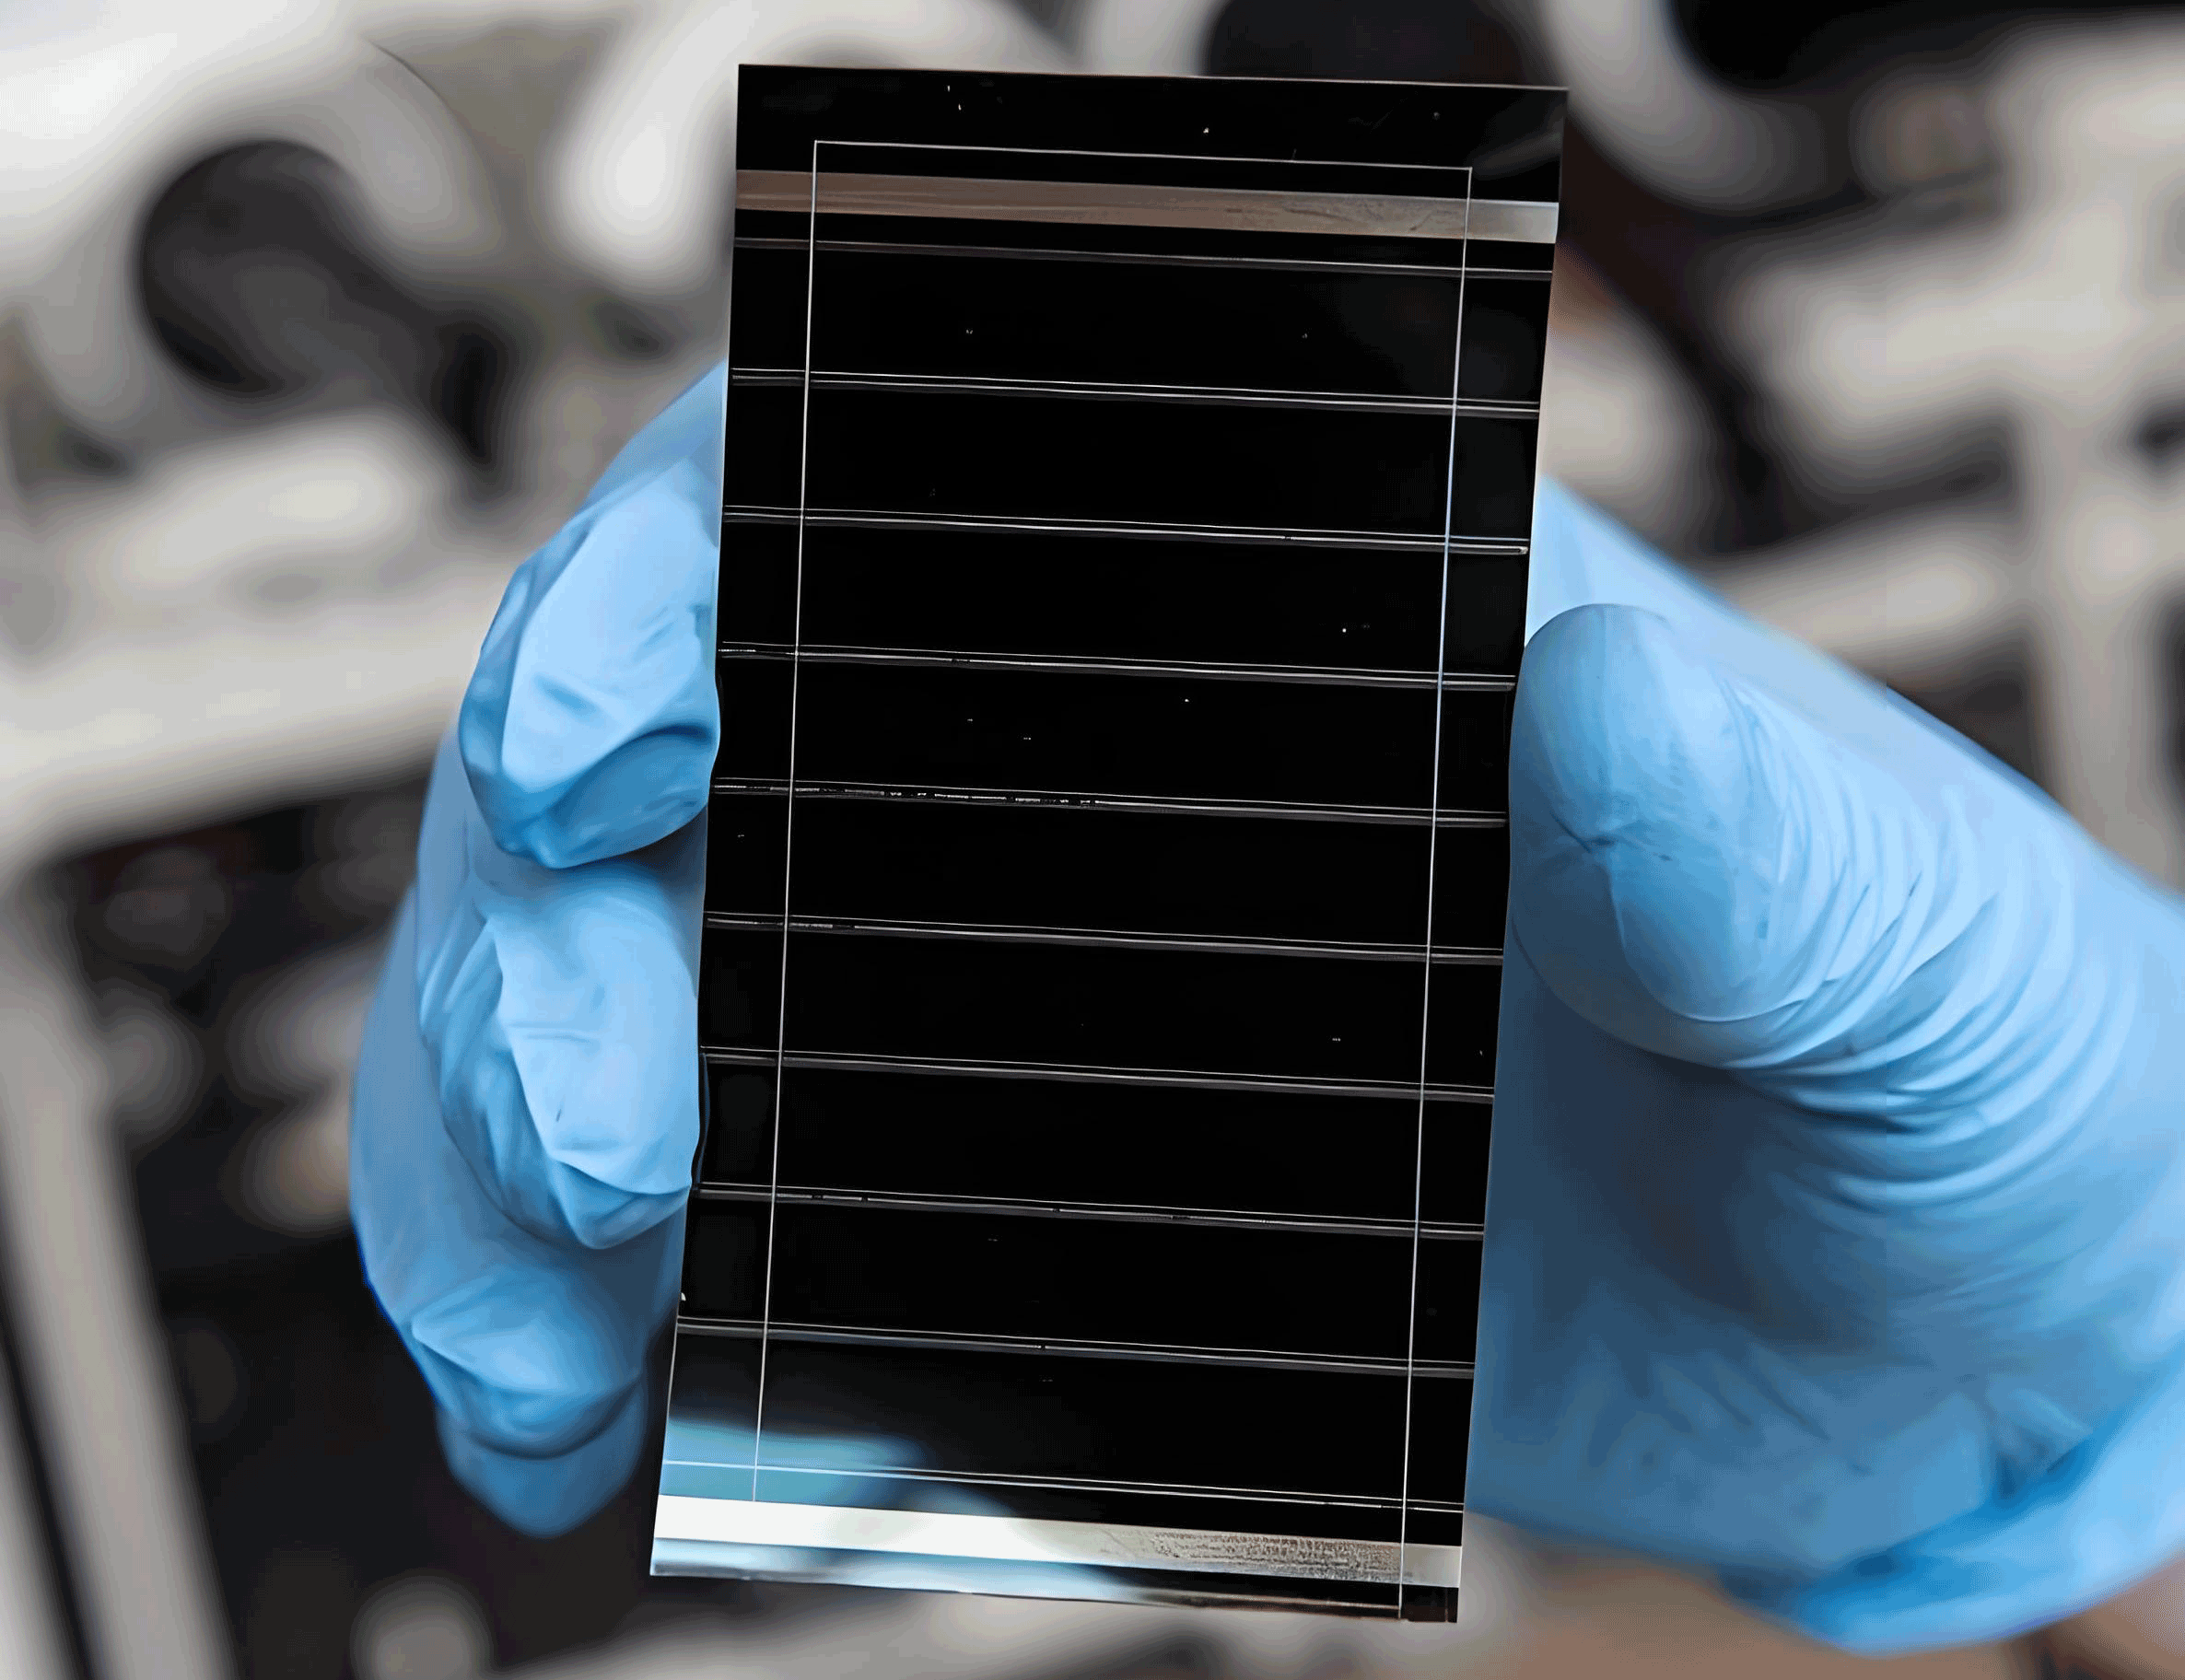
As global energy demands escalate and environmental concerns intensify, the shift toward clean and renewable energy sources has become imperative. Solar energy, in particular, stands out as a cornerstone of sustainable development, with perovskite solar cells emerging as a disruptive technology in the photovoltaic landscape. These third-generation solar cells offer remarkable advantages, including high power conversion efficiencies, low production costs, and simplified fabrication processes. The rapid evolution of perovskite solar cell technology underscores the need for efficient intellectual property protection mechanisms, such as patent pre-examination services, to accelerate innovation and commercialization. This study analyzes the development trends of perovskite solar cells through the lens of patent pre-examination classification numbers, specifically focusing on International Patent Classification (IPC) codes. By examining patent data, technological distributions, regional patterns, and key applicants, I aim to provide insights into how pre-examination services can be optimized to support this burgeoning field.
The data for this analysis were sourced from global patent databases, with a comprehensive search conducted using keywords such as “perovskite solar cells,” “PSC,” “ABX3,” and related terms, combined with relevant IPC codes. The search encompassed patents published up to November 27, 2024, resulting in a curated dataset of 6,992 patents after deduplication and noise reduction. The analysis involved statistical evaluations of patent trends, IPC classifications, geographical distributions, and major applicants. Additionally, I reviewed the publicly available pre-examination IPC classification numbers from intellectual property protection centers across various regions to assess their alignment with the technological focus of perovskite solar cells. This multifaceted approach allows for a holistic understanding of the patent landscape and its implications for innovation in perovskite solar cell technology.
The global patent trend for perovskite solar cells reveals a significant growth trajectory, particularly from 2013 onward. This surge coincides with key technological breakthroughs, such as the development of all-solid-state perovskite solar cells, which addressed stability issues and boosted efficiency. China has emerged as a dominant player in this domain, accounting for the largest share of patent applications worldwide. The annual distribution of patents highlights a consistent increase, with a notable shift in technological emphasis over time. To quantify this growth, I applied an exponential model to the patent data, represented by the equation: $$ P(t) = P_0 e^{kt} $$ where \( P(t) \) is the number of patents at time \( t \), \( P_0 \) is the initial count, and \( k \) is the growth rate. This model captures the rapid expansion in patent activity, underscoring the accelerating pace of innovation in perovskite solar cells.
| IPC Subclass | Number of Patents | Technical Theme |
|---|---|---|
| H01L | 4670 | Semiconductor devices; not included in class H10 |
| H10K | 1921 | Organic electric solid-state devices |
| C23C | 179 | Coating metallic material; surface treatment |
| H01G | 133 | Capacitors; electrolytic capacitors, rectifiers |
| C07F | 55 | Acyclic, carbocyclic, or heterocyclic compounds |
| C09D | 40 | Coating compositions; inks; wood stains |
| H01M | 3 | Direct conversion of chemical energy to electrical energy |
| C03C | 2 | Glass compositions; surface treatment of glass |
The technological distribution of perovskite solar cell patents is predominantly concentrated in the H (Electricity) and C (Chemistry; Metallurgy) sections of the IPC. As shown in Table 1, subclasses H01L and H10K collectively represent approximately 94% of all patents, indicating a strong focus on electrical devices and organic solid-state components. A deeper analysis of IPC main groups, as summarized in Table 2, reveals that specific categories like H01L51/42 (photovoltaic conversion) and H01L51/48 (manufacturing methods) are the most prevalent. This highlights the centrality of photoelectric conversion technologies and device optimization in perovskite solar cell research. The efficiency of these cells can be modeled using the formula: $$ \eta = \frac{J_{sc} \times V_{oc} \times FF}{P_{in}} \times 100\% $$ where \( \eta \) is the power conversion efficiency, \( J_{sc} \) is the short-circuit current density, \( V_{oc} \) is the open-circuit voltage, \( FF \) is the fill factor, and \( P_{in} \) is the incident light power. This equation underscores the key parameters driving innovation in perovskite solar cell performance.
| IPC Main Group | Number of Patents | Percentage | Technical Theme |
|---|---|---|---|
| H01L51/42 | 1518 | 21.68% | Specifically adapted for sensing radiation and converting it to electricity |
| H01L51/48 | 782 | 11.17% | Methods or apparatus for manufacturing or processing such devices |
| H10K30/50 | 461 | 6.58% | Photovoltaic [PV] devices |
| H01L51/44 | 372 | 5.31% | Components of the devices |
| H10K30/88 | 344 | 4.91% | Passivation; containers; encapsulation |
| H01L31/18 | 274 | 3.91% | Methods or apparatus for manufacturing or processing |
| H01L51/46 | 231 | 3.30% | Selection of materials |
| H01L51/00 | 228 | 3.26% | Solid devices using organic materials as active parts |
| H01L31/048 | 189 | 2.70% | Encapsulation of modules |
| H10K85/50 | 159 | 2.27% | Organic perovskites; hybrid organic-inorganic perovskites [HOIP] |
The temporal evolution of patent classifications, illustrated in Figure 2, demonstrates a pivotal shift in research focus. Initially, patents were predominantly classified under H01L (semiconductor devices), peaking around 2018. However, from 2016 onward, there was a gradual increase in H10K (organic electric solid-state devices) patents, which accelerated significantly after 2022, eventually surpassing H01L in 2023. This transition reflects a broader technological maturation, where innovations in organic components and hybrid materials are gaining prominence. The growth in H10K patents can be described by a logistic function: $$ N(t) = \frac{L}{1 + e^{-k(t – t_0)}} $$ where \( N(t) \) is the number of patents at time \( t \), \( L \) is the carrying capacity, \( k \) is the growth rate, and \( t_0 \) is the inflection point. This model captures the S-shaped growth pattern typical of emerging technologies like perovskite solar cells.
Geographically, patent applications for perovskite solar cells are concentrated in eastern economic zones of China, with cities like Beijing, Suzhou, and Xi’an leading in volume. This regional disparity is evident in Table 3, which summarizes the distribution across major cities. The dominance of eastern regions underscores the role of industrial clusters and economic policies in driving innovation. In contrast, central and western regions have fewer applications, highlighting opportunities for growth and investment in these areas. The concentration of patents in specific locales can be analyzed using a spatial distribution index, such as the Gini coefficient, which measures inequality. For patent density \( d_i \) in region \( i \), the coefficient is given by: $$ G = \frac{\sum_{i=1}^n \sum_{j=1}^n |d_i – d_j|}{2n \sum_{i=1}^n d_i} $$ where \( n \) is the number of regions. A high Gini coefficient would indicate significant disparities, urging targeted support for underrepresented areas.
| City | Number of Patents (H01L) | Number of Patents (H10K) | Other Patents |
|---|---|---|---|
| Beijing | ~300 | ~150 | ~50 |
| Suzhou | ~250 | ~100 | ~30 |
| Xi’an | ~200 | ~80 | ~20 |
| Shenzhen | ~180 | ~70 | ~25 |
| Wuhan | ~160 | ~60 | ~15 |
| Hangzhou | ~140 | ~50 | ~10 |
| Changzhou | ~120 | ~40 | ~5 |
| Shanghai | ~100 | ~30 | ~5 |
| Chengdu | ~80 | ~20 | ~5 |
| Wuxi | ~60 | ~10 | ~5 |
Key applicants in the perovskite solar cell domain include a mix of enterprises and academic institutions, as detailed in Table 4. Leading companies, such as those in the solar energy sector, have filed substantial numbers of patents, often focusing on scalable manufacturing and efficiency improvements. Universities, on the other hand, contribute foundational research, with patents covering material science and device physics. The collaboration between industry and academia is crucial for translating laboratory discoveries into commercial applications. The innovation output can be modeled using a production function: $$ Y = A \cdot K^\alpha \cdot L^\beta $$ where \( Y \) is the patent output, \( A \) is total factor productivity, \( K \) is capital investment, \( L \) is labor (researchers), and \( \alpha \) and \( \beta \) are output elasticities. This highlights the importance of resource allocation in advancing perovskite solar cell technology.
| Applicant Type | Representative Entities | Number of Patents (H01L) | Number of Patents (H10K) | Other Patents |
|---|---|---|---|---|
| Enterprises | Solar energy companies | ~200-350 | ~100-200 | ~20-50 |
| Universities | Technical and research institutes | ~100-250 | ~50-150 | ~10-30 |
The alignment of patent pre-examination services with technological trends is critical for fostering innovation. An analysis of intellectual property protection centers reveals that only six centers currently include the H10K classification in their pre-examination scope, despite its growing importance in perovskite solar cell patents. This gap can hinder the rapid patenting process, as applications may not qualify for accelerated review. The coverage of IPC classifications across centers is summarized in Table 5, showing that H01L is widely supported, while H10K is limited. To address this, centers should periodically update their classification ranges based on industry developments and IPC revisions. The optimization of pre-examination services can be framed as a resource allocation problem, maximizing the utility function: $$ U = \sum_{i=1}^n w_i \cdot C_i $$ where \( U \) is the overall utility, \( w_i \) is the weight for classification \( i \), and \( C_i \) is the coverage level. This approach ensures that pre-examination resources are allocated to high-impact areas like perovskite solar cells.
| IPC Classification | Number of Centers Covering It | Examples of Centers |
|---|---|---|
| H01L | 41 | Centers in Beijing, Shanghai, Guangdong |
| H10K | 6 | Centers in Hangzhou, Foshan, Shanghai |
| C23C | 31 | Centers in Jiangsu, Zhejiang |
| H01G | 14 | Centers in Hubei, Shaanxi |
| C07F | 15 | Centers in Fujian, Sichuan |
| C09D | 23 | Centers in Tianjin, Hunan |
| H01M | 43 | Centers nationwide |
| C03C | 23 | Centers in Anhui, Henan |
In conclusion, the development of perovskite solar cells is characterized by rapid patent growth, a shift toward organic solid-state devices, and regional concentrations in innovation hubs. The patent pre-examination system plays a vital role in accelerating the protection of these advancements, but its effectiveness depends on the alignment of IPC classifications with technological trends. I recommend that intellectual property protection centers regularly review and expand their pre-examination scopes to include emerging classifications like H10K, particularly in regions with strong perovskite solar cell activities. Additionally, fostering cross-disciplinary collaboration and international patent strategies will enhance the global competitiveness of this technology. By leveraging data-driven insights and adaptive policies, stakeholders can ensure that perovskite solar cells realize their full potential as a transformative energy solution.