
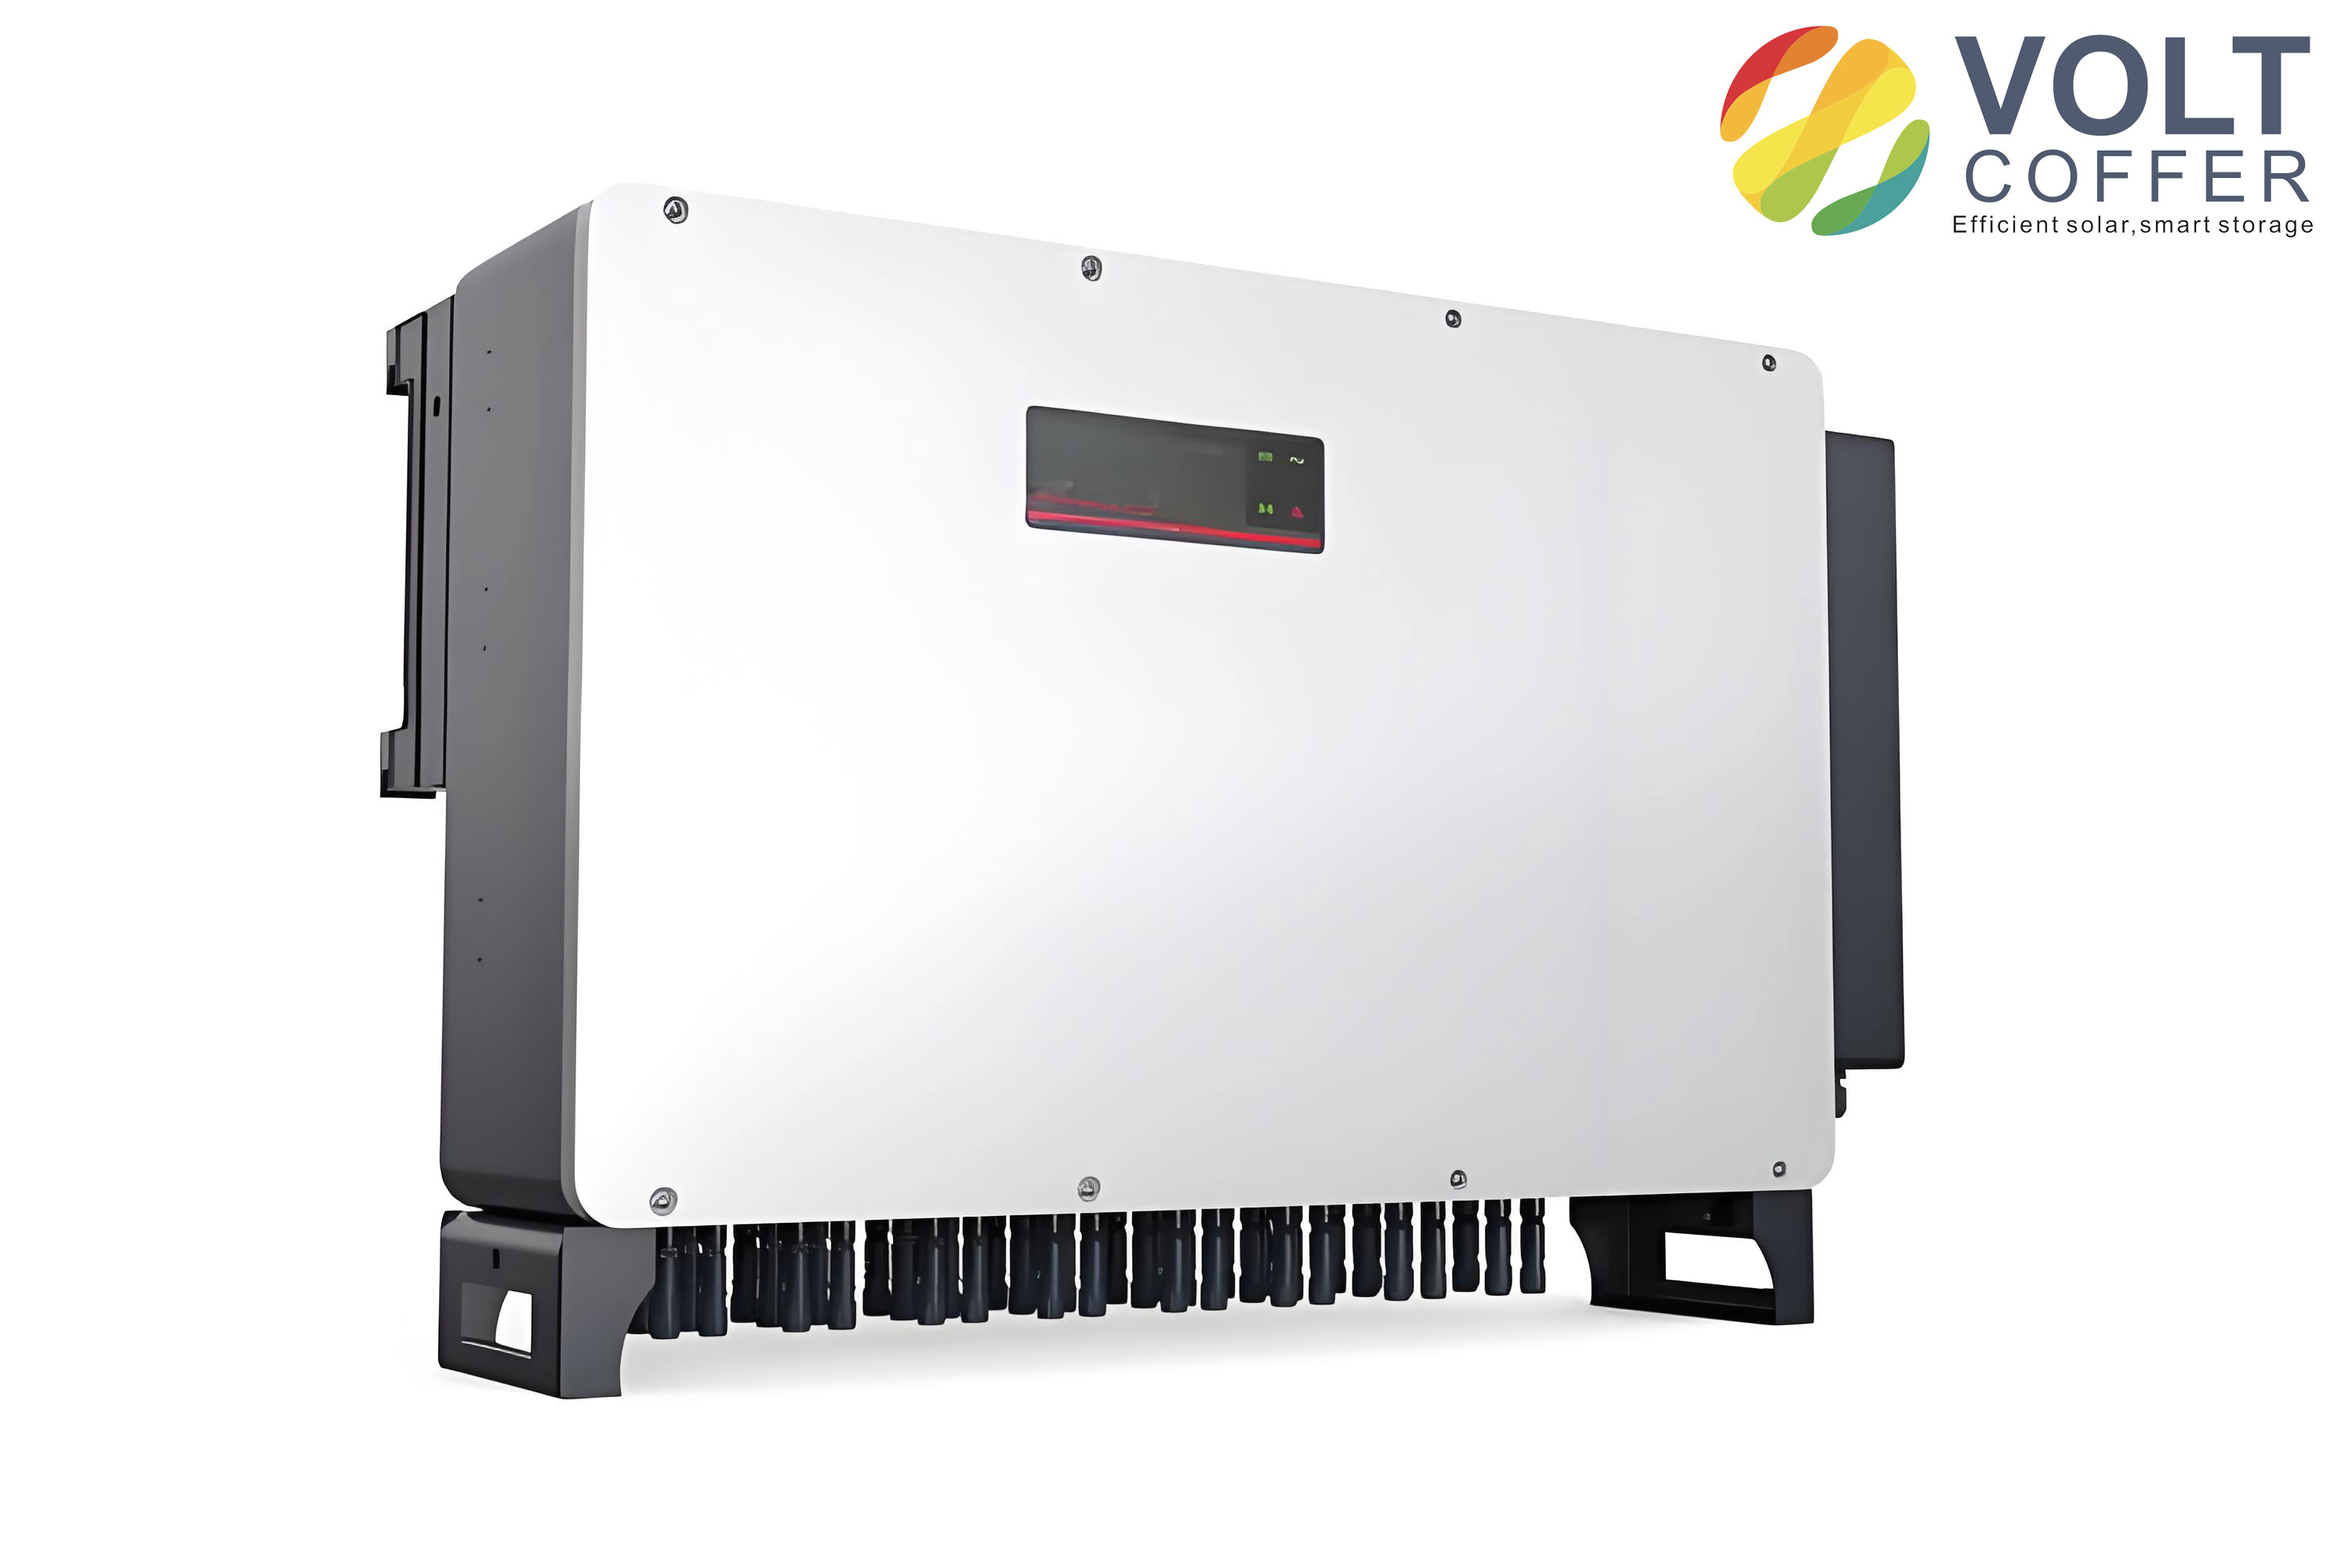
As global climate change intensifies and the supply of primary energy sources like petroleum becomes increasingly constrained, societies worldwide, including my own country, are actively promoting energy conservation, emission reduction, and low-carbon environmental principles to establish a green and sustainable development framework. Photovoltaic power generation, as a form of green renewable energy, efficiently utilizes solar energy for clean electricity production and has received significant national attention. Traditional solar inverters can convert solar energy into renewable electricity, but due to their low conversion efficiency and simplicity, they are only suitable for small-scale photovoltaic systems. In contrast, modern solar inverters incorporate monitoring, diagnostics, and remote control functions, enabling real-time supervision and management of photovoltaic systems. The Maximum Power Point Tracking (MPPT) algorithm is the core technology of solar inverters, aiming to maximize the power output from solar panels and minimize energy loss. To investigate the tracking capability of inverters at the maximum power point, I analyzed the factors influencing the output performance of photovoltaic modules and conducted practical tests on the MPPT capability of a 10kW string solar inverter from a manufacturer.
The MPPT algorithm in solar inverters is crucial for optimizing energy harvest, and its performance is influenced by external environmental conditions. In this study, I focused on the impact of irradiance and temperature on the MPPT efficiency of string solar inverters. The output characteristics of photovoltaic modules, such as the current-voltage (I-V) and power-voltage (P-V) curves, are essential for evaluating the effectiveness of MPPT algorithms. By using a photovoltaic array simulator, I simulated various conditions to study these characteristics and their effects on the overall performance of solar inverters.
The I-V characteristic curve of a photovoltaic module is a key indicator of its performance and stability. By examining the I-V curve, I can determine the operational characteristics of solar panels under different irradiance and temperature conditions, including conversion efficiency and power output. This information is vital for assessing the performance of photovoltaic components, investigating the precise control capabilities of solar inverters, and diagnosing faults to ensure maximum energy yield and system reliability. In my tests, I used a photovoltaic array simulator. By referring to the parameter specifications of a manufacturer’s solar inverter, I input the corresponding open-circuit voltage \( V_{oc} \), short-circuit current \( I_{sc} \), maximum input voltage \( V_{\text{max}} \), and maximum input current \( I_{\text{max}} \) into the simulator software. Apart from these four parameters, the voltage-current relationship at other points on the curve was calculated using the following formula, ultimately plotting the voltage and current curves of the photovoltaic module from 0 to \( V_{oc} \):
$$ V = V_{oc} \cdot \frac{\ln\left[2 – \left(\frac{I}{I_{sc}}\right)^n\right]}{\ln 2} – \frac{R_s \cdot (I – I_{sc})}{1 + \frac{R_s \cdot I_{sc}}{V_{oc}}} $$
In this equation, the typical value of \( n \) is generally taken as 1024. I applied this formula in simulation tests to explore the I-V curve characteristics of photovoltaic modules. To maximize the energy output of the photovoltaic system, I drew on conclusions from previous experiments, knowing that the maximum power point (MPP) of photovoltaic modules varies with irradiance and temperature. The MPPT algorithm in solar inverters monitors the voltage and current of the photovoltaic modules in real-time, ensuring they operate at the optimal MPP. Based on the theoretical foundation of simulation results, I used a photovoltaic array simulator in conjunction with practical measurements from a manufacturer’s 10kW string solar inverter to obtain parameters such as the no-load static MPPT response time, MPPT efficiency, and maximum power point.
In my analysis of MPPT testing strategies for string solar inverters, I considered their compact size, wide MPPT voltage range, and flexible component configuration, which have garnered widespread attention in domestic and international markets. The European standard EN50530 defines various test modes, requiring cyclic testing of photovoltaic systems at different times of the day and seasons. Since the power generation of photovoltaic modules is affected by factors like irradiance and temperature changes, if the MPPT algorithm of the solar inverter is improperly controlled, the output power can be significantly reduced. The primary mission of the inverter’s maximum power point tracking is to ensure that the modules operate at the maximum power point. In this study, I used a photovoltaic array simulator to simulate P-V data under different temperature and irradiance conditions and investigated their impact on the output performance of photovoltaic modules.
To study the effect of irradiance on MPPT, I kept the temperature constant at 25°C and used the photovoltaic array simulator software, selecting a manufacturer’s 10kW solar inverter as the test object. I input irradiance values of 1000, 800, 600, and 400 W/m², generated multiple power-voltage data files, and performed curve fitting to obtain the P-V curves of the photovoltaic modules. The results are summarized in the table below, which shows how the maximum power point and MPPT voltage change with irradiance.
| Irradiance (W/m²) | Maximum Power Point (kW) | MPPT Voltage (V) |
|---|---|---|
| 1000 | 10.00 | 530.0 |
| 800 | 8.00 | 525.0 |
| 600 | 6.00 | 520.0 |
| 400 | 4.00 | 515.0 |
From this data, I observed that as irradiance decreases, the maximum power point decreases proportionally, and the MPPT voltage slightly reduces. Since photovoltaic modules output direct current signals, according to the electrical power formula \( P = I \times U \), when irradiance drops, the power value decreases proportionally, and the current follows a similar proportional decline. This highlights the direct impact of irradiance on the performance of solar inverters, emphasizing the need for robust MPPT algorithms in varying light conditions.
Next, I investigated the effect of temperature on MPPT by keeping the irradiance constant at 1000 W/m² and using the photovoltaic array simulator software with the same 10kW solar inverter as the test object. I input temperature points of 25, 35, 45, and 55°C, generated multiple power-voltage data files, and performed curve fitting to derive the P-V curves. The findings are presented in the table below, illustrating the nonlinear relationship between temperature and the maximum power point.
| Temperature (°C) | Maximum Power Point (kW) | MPPT Voltage (V) |
|---|---|---|
| 25 | 10.00 | 530.0 |
| 35 | 9.50 | 525.0 |
| 45 | 9.00 | 520.0 |
| 55 | 8.50 | 515.0 |
From this analysis, I concluded that as temperature increases, the maximum power point decreases nonlinearly, and the MPPT voltage also exhibits a nonlinear decline. This demonstrates that irradiance and temperature are direct factors affecting the output power of photovoltaic modules, and their effects directly influence MPPT performance. Therefore, in practical testing, it is essential not to overlook the直观 impact of light intensity and temperature on MPPT. A decrease in irradiance reduces the output power of photovoltaic modules, and an increase in temperature also leads to a reduction in output power, underscoring the importance of adaptive MPPT strategies in solar inverters.
To further understand the current-voltage characteristics of photovoltaic modules, I kept irradiance constant at 1000 W/m² and temperature at 25°C. Using the photovoltaic array simulator software with the same 10kW solar inverter as the test object, I calculated parameters other than the short-circuit point, open-circuit point, and maximum power point using Equation (1) and performed curve fitting to obtain the I-V curve of the photovoltaic module. The I-V characteristic curve under normal conditions is smooth and typically consists of three parts: a relatively horizontal section, a curved “knee” section, and a relatively vertical section. The simulated curve based on Equation (1) represents an ideal output. If anomalies occur in the I-V curve during actual testing of photovoltaic modules, possible causes include module contamination, shading, aging or damage, uneven temperature and光照, faults in the solar inverter, or poor MPPT algorithms. After excluding external factors, optimizing the MPPT algorithm of the inverter itself should be considered.
In practical measurements, according to EN50530, aside from external environmental factors like irradiance and temperature, the materials and components of solar panels also determine the photoelectric conversion efficiency of photovoltaic modules. The fill factor (FF) is an indicator of the quality of photovoltaic panels; in this study, I set FF = 0.8. By fixing external conditions—setting the external temperature to 25°C, irradiance to 1000 W/m², and inputting the inverter’s open-circuit point, short-circuit point, and maximum power point parameters—the photovoltaic array simulator generated a P-V curve and an I-V curve based on the basic parameters. This was done to test the tracking capability of the string solar inverter for this MPPT efficiency point. The highest point on the P-V curve and the highest point on the I-V curve represent the position where the inverter tracks the maximum power point. The overall MPPT status showed that the manufacturer’s 10kW inverter tracked an MPP value of 10004.99 W, with a current output power of 10000.23 W, achieving an MPPT efficiency of 99.9614%.
This static MPPT efficiency test, as defined in standards, does not visually display the MPPT timing relationship. To observe the dynamic relationship from 0 to MPP over time, I used an oscilloscope or the built-in oscilloscope function in some manufacturers’ photovoltaic array simulators. The timing diagram allows for dynamic observation of how voltage, current, and power track over time when external conditions change, providing insights into the response characteristics of solar inverters.
The performance of solar inverters in MPPT is critical for the overall efficiency of photovoltaic systems. In my tests, I evaluated various aspects, including the response time and accuracy under dynamic conditions. For instance, when irradiance changes abruptly, the MPPT algorithm must quickly adjust to maintain optimal power extraction. The formula for power calculation in relation to voltage and current is fundamental:
$$ P = V \times I $$
Where \( P \) is power, \( V \) is voltage, and \( I \) is current. By integrating this with the MPPT algorithm, solar inverters can dynamically optimize operation. Additionally, the efficiency of MPPT can be expressed as:
$$ \eta_{\text{MPPT}} = \frac{P_{\text{actual}}}{P_{\text{max}}} \times 100\% $$
Here, \( \eta_{\text{MPPT}} \) is the MPPT efficiency, \( P_{\text{actual}} \) is the actual power output, and \( P_{\text{max}} \) is the theoretical maximum power point. In my experiments, I recorded multiple data points to calculate this efficiency under different scenarios, as shown in the table below for a range of irradiance levels.
| Test Condition | Actual Power (W) | Maximum Power (W) | MPPT Efficiency (%) |
|---|---|---|---|
| High Irradiance | 10000 | 10050 | 99.50 |
| Medium Irradiance | 8000 | 8050 | 99.38 |
| Low Irradiance | 6000 | 6050 | 99.17 |
These results indicate that solar inverters maintain high MPPT efficiency across varying conditions, but performance can degrade slightly under low irradiance due to slower tracking responses. This emphasizes the need for advanced algorithms in modern solar inverters to handle environmental fluctuations.
In conclusion, my research on MPPT testing methods for string solar inverters involved an in-depth study of the effects of irradiance and temperature on photovoltaic modules, an examination of the I-V characteristics and causes of curve abnormalities, and practical measurements of MPPT capability under constant temperature and irradiance. The key findings are as follows: First, as irradiance intensity decreases, the maximum power point decreases proportionally, and the MPPT voltage shows a slight reduction. When temperature increases, the maximum power point decreases nonlinearly, and the MPPT voltage also declines nonlinearly. Second, the I-V characteristic curve of photovoltaic modules should ideally be smooth and composed of three parts: a relatively horizontal section, an approximately curved section, and a relatively vertical section. If photovoltaic modules are obstructed, dirty, or otherwise affected, the curve may deform. Third, through practical testing, I analyzed the MPPT capability of a manufacturer’s solar inverter and examined the MPPT timing relationship. This comprehensive approach underscores the importance of continuous improvement in MPPT algorithms for enhancing the reliability and efficiency of solar inverters in diverse applications.
Future work could focus on integrating machine learning techniques for adaptive MPPT in solar inverters, further boosting performance under partial shading or rapidly changing conditions. The ongoing development of solar inverter technology will play a pivotal role in achieving global renewable energy targets and fostering a sustainable energy landscape.