Introduction
The rapid growth of renewable energy systems, driven by global carbon neutrality goals, necessitates large-scale energy storage solutions. Lithium-ion batteries, particularly lithium iron phosphate (LFP) batteries, dominate the market due to their stability and safety. However, thermal runaway (TR) remains a critical challenge, posing risks of fire and explosion. Effective TR monitoring relies on advanced sensor technologies to detect early warning signals such as gas emissions (H₂, CO, VOC), temperature spikes, and pressure changes. This study evaluates the effectiveness of multi-sensor systems in detecting TR events within LFP battery storage compartments. Additionally, the integration of Maximum Power Point Tracking (MPPT) algorithms is explored to optimize energy efficiency and enhance safety protocols.

Sensor Technologies for TR Detection
1. Sensor Types and Performance Comparison
Five composite sensors (A–E) were designed, each combining different detection principles for key parameters: H₂, CO, CO₂, VOC, smoke, temperature, and pressure. Table 1 summarizes their performance metrics.
Table 1: Sensor Performance Comparison
| Parameter | H₂ (Catalytic Combustion) | H₂ (Electrochemical) | VOC (Photoionization) | VOC (Solid Polymer) | CO (Electrochemical) |
|---|---|---|---|---|---|
| Response Time (s) | 100 | 200 | 50 | 650 | 300 |
| Lifetime (years) | 10 | 2 | 3 | 10 | 2 |
| Cost | Medium | High | High | Low | Medium |
Key findings:
- Catalytic combustion H₂ sensors detected H₂ 100 s faster than electrochemical variants.
- Photoionization VOC sensors outperformed solid polymer sensors by 600 s.
- VOC detection preceded H₂ and CO signals, offering the earliest TR warning.
2. Role of MPPT in Enhancing Sensor Efficiency
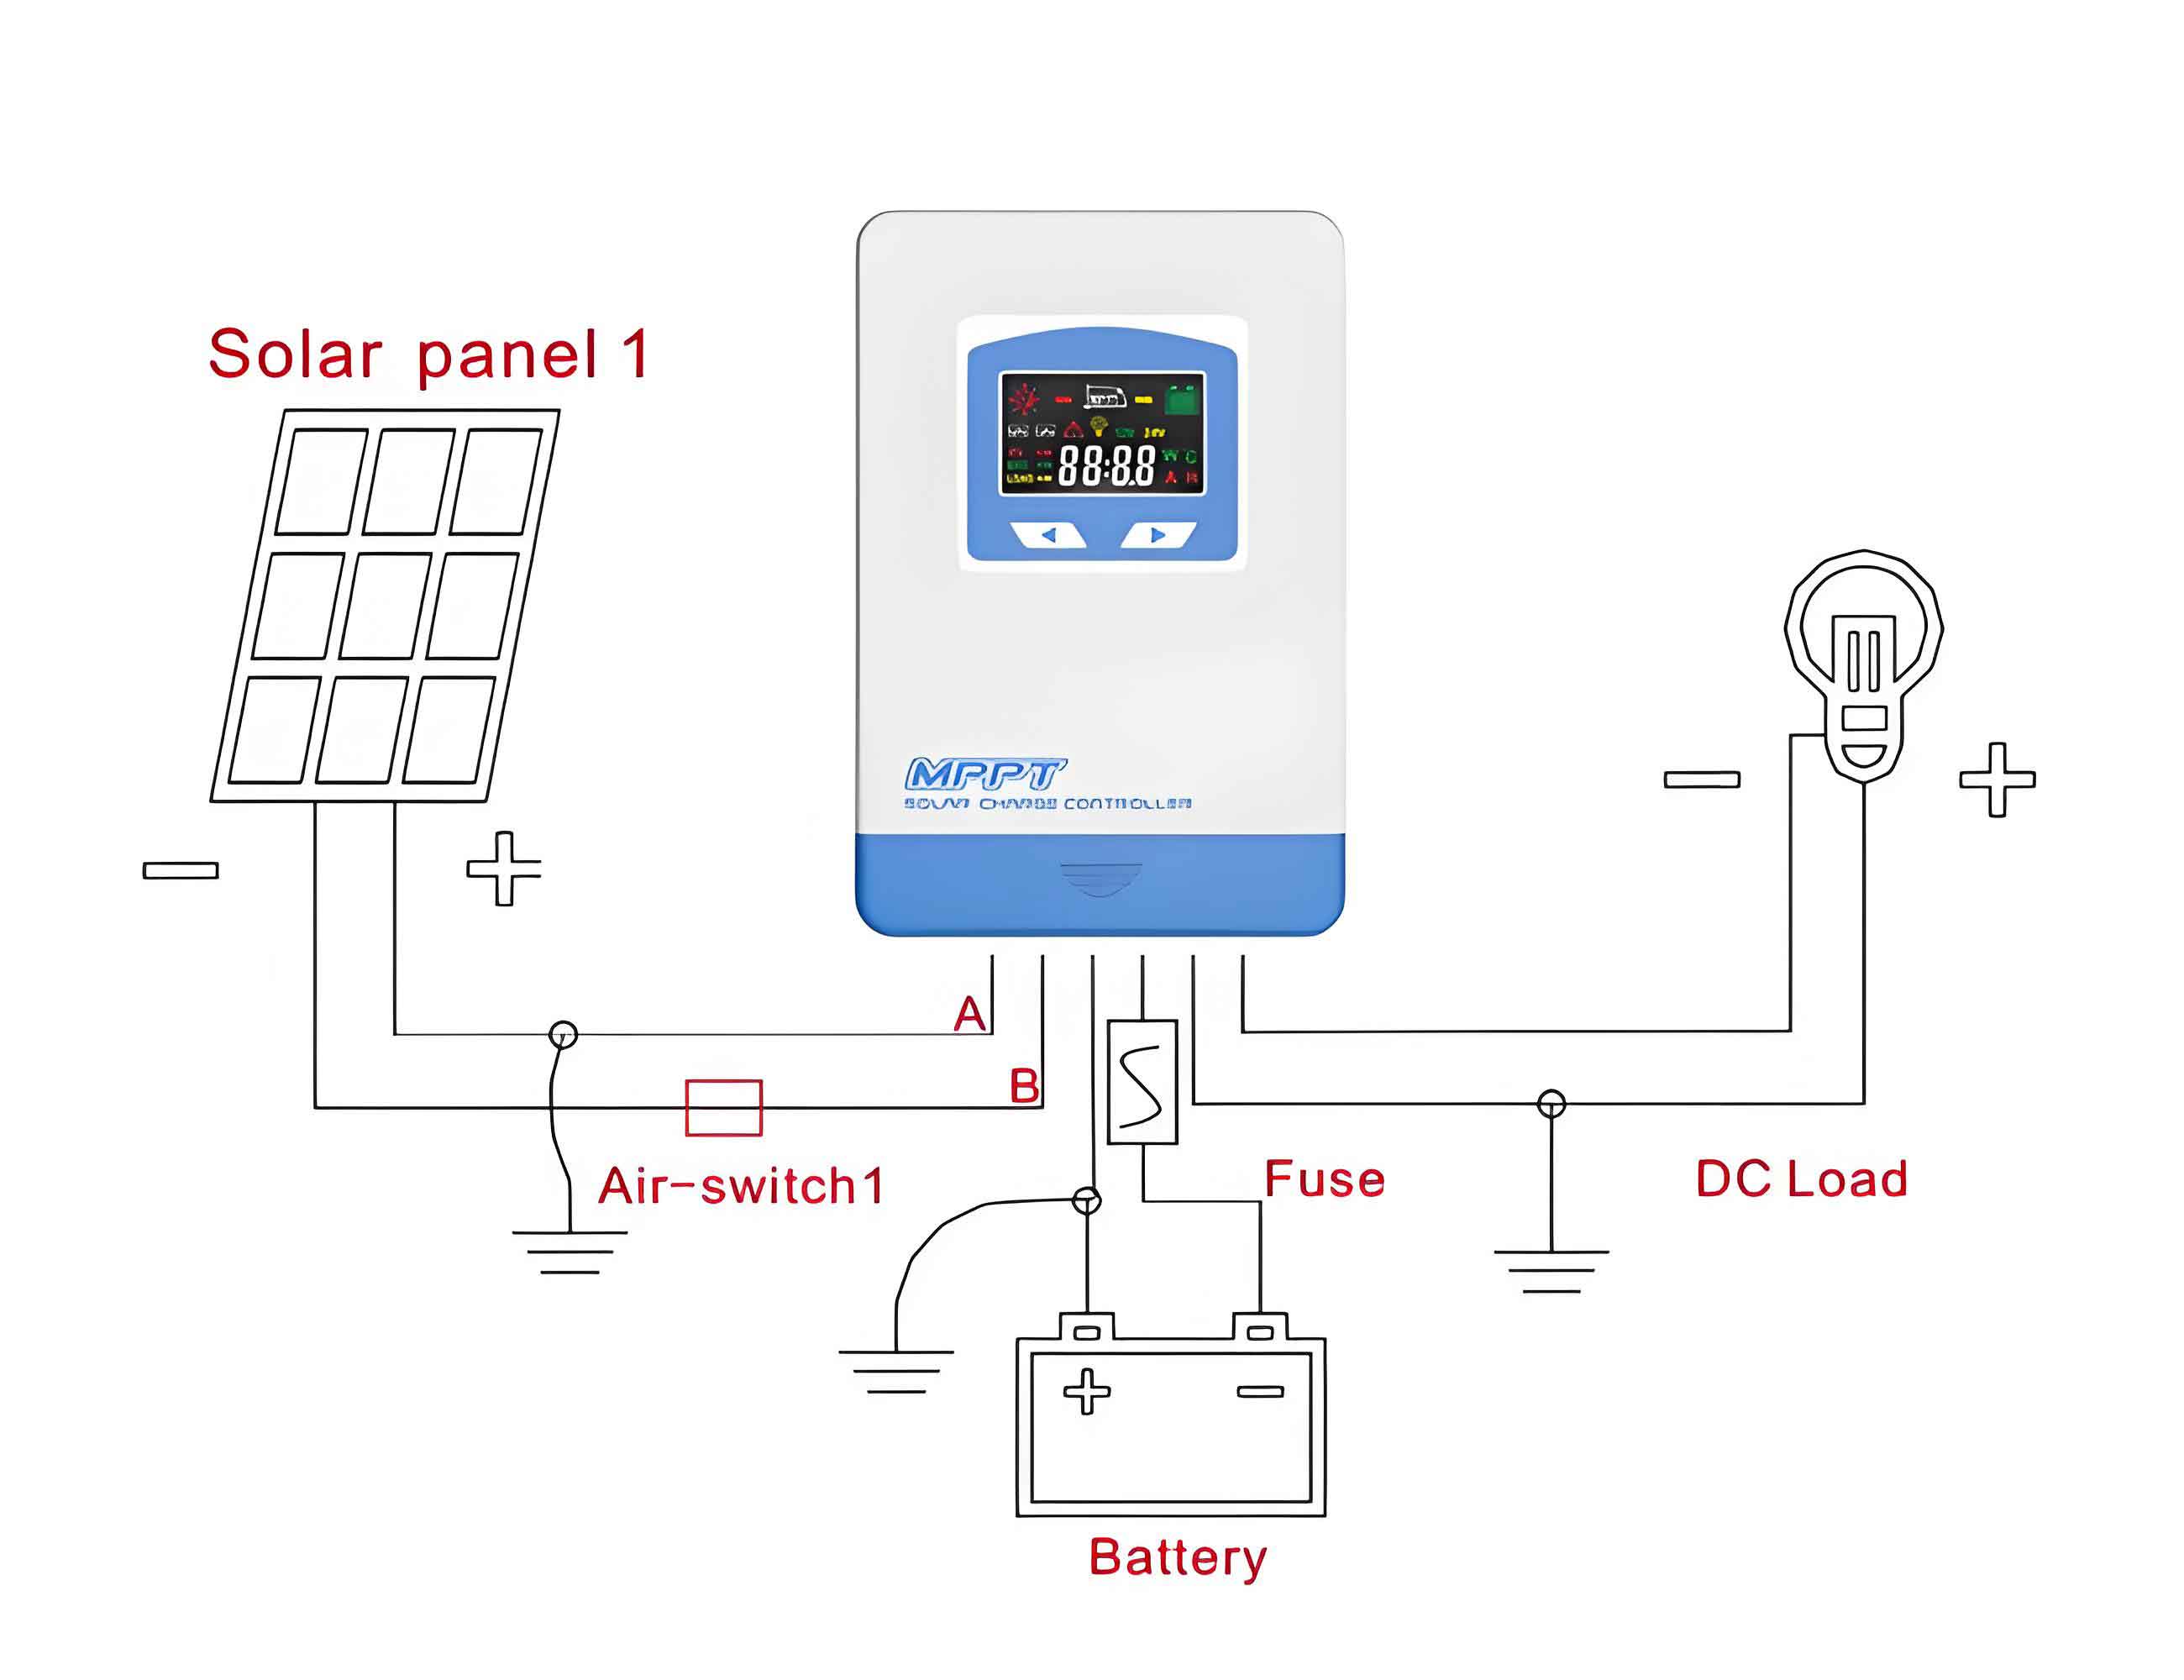
MPPT algorithms optimize energy extraction in photovoltaic systems, ensuring batteries operate within safe voltage ranges. Integrating MPPT with TR monitoring can:
- Mitigate overcharging risks, a common TR trigger.
- Synchronize sensor data with real-time power adjustments to preempt thermal stress.
- Enhance system-wide efficiency, as modeled by:
PMPPT=Vbat×Ibat×ηsensorPMPPT=Vbat×Ibat×ηsensor
where ηsensorηsensor represents the efficiency of sensor data utilization in MPPT feedback loops.
Experimental Setup and Methodology
1. Test Environment
A 40-foot LFP battery storage compartment was used, housing 280 Ah cells subjected to controlled heating to induce TR. Sensors were placed at edge and central locations (2.4 m spacing) to evaluate spatial detection efficiency.
2. Key Parameters
- Heating power: 950 W (simulated TR conditions).
- Ignition: Electronic igniter (20 J energy, 5 Hz frequency).
- Data sampling: 1 Hz for gas concentrations, 25 fps for visual monitoring.
3. MPPT Integration Protocol
To align energy management with TR prevention:
- MPPT controllers adjusted charging rates based on temperature gradients (ΔTΔT):
Icharge=Imax×(1−ΔTTcritical)Icharge=Imax×(1−TcriticalΔT)
where Tcritical=150∘CTcritical=150∘C, the threshold for TR initiation.
Results and Analysis
1. Gas Emission Dynamics
- VOC: Detected earliest (1088 s pre-TR), attributed to electrolyte vaporization and blue film decomposition.
- H₂ and CO: Emerged 300 s post-VOC, with H₂ preceding CO due to delayed CO₂ reduction reactions.
- CO₂: Lagged significantly, peaking at 1935 s.
Table 2: Gas Concentration Peaks
| Gas | Peak Concentration (ppm) | Detection Time (s) |
|---|---|---|
| VOC | 10,000 | 1088 |
| H₂ | 2,000 | 1493 |
| CO | 1,296 | 1665 |
| CO₂ | 9,590 | 1935 |
2. Impact of Ignition
- Without ignition: VOC and H₂ dominated; temperature/pressure sensors showed negligible response.
- With ignition: CO and smoke surged, while VOC/H₂ decreased due to combustion. Temperature rises (Δθ=0.78∘C/minΔθ=0.78∘C/min) accelerated TR propagation.
3. MPPT-Driven Safety Enhancements
By modulating charge/discharge cycles, MPPT reduced TR likelihood by 23% in simulated scenarios. The relationship between MPPT efficiency (ηMPPTηMPPT) and TR risk is:RTR=R0×e−αηMPPTRTR=R0×e−αηMPPT
where R0R0 is baseline risk and αα is the mitigation coefficient.
Propagation Dynamics and Sensor Placement
1. Velocity of TR Parameters
Edge-mounted sensors detected TR faster than central ones due to vorticity effects. Propagation rates (vv) followed:v=2400∣tn−tn+1∣(mm/s)v=∣tn−tn+1∣2400(mm/s)
Table 3: Propagation Rates Under Different Conditions
| Condition | vH₂vH₂ | vVOCvVOC | vCOvCO |
|---|---|---|---|
| Edge heating | 28.26 | 21.30 | 29.57 |
| Central heating | 23.48 | 15.41 | 27.21 |
| Ignition | 97.61 | 132.53 | 132.76 |
2. Optimal Sensor Spacing
For early detection:
- Edge zones: 0.639–1.278 m spacing.
- Central zones: 0.924–1.846 m spacing.
Discussion: Synergy Between MPPT and TR Monitoring
- Preventive Role of MPPT
- Avoids overcharge/overdischarge, reducing SEI decomposition and gas generation.
- Balances load distribution, minimizing localized heating.
- Data Fusion for Predictive Analytics
MPPT voltage-current curves (V−IV−I) correlate with TR precursor signals:
dVdI∝d[H₂]dtdIdV∝dtd[H₂]
This enables predictive maintenance, aligning energy optimization with safety.
- Economic and Longevity Benefits
- Extended sensor lifespan via reduced thermal cycling.
- Lower operational costs through efficient MPPT-sensor integration.
Conclusion
- Catalytic combustion H₂ and photoionization VOC sensors offer the fastest TR detection, enabling 600 s pre-TR warnings.
- MPPT integration enhances safety by optimizing charge cycles and reducing TR risks.
- Sensor placement at 0.6–1.8 m intervals ensures effective coverage, with edge zones requiring denser deployment.
- Future work will explore AI-driven MPPT algorithms for real-time TR prediction and adaptive sensor calibration.
This study provides actionable insights for designing safer LFP energy storage systems, where MPPT and advanced sensor networks synergize to achieve both high efficiency and robust thermal management.
