
Abstract: In desertification areas, the influence of dust deposition on the performance of solar panels is a significant issue. This article comprehensively studies the dust deposition characteristics on the surface of solar panels in windy and sandy environments and its impact on transmittance through fluid dynamics simulation. It includes the construction of numerical calculation models, the analysis of simulation results, and the discussion of the relationship between various factors and dust deposition and transmittance. The research results provide important references for the construction and operation of solar power plants in desertification areas.

1. Introduction
With the increasing global energy crisis and environmental problems, the development of renewable energy has become an important trend. Solar power generation, as one of the most mature and widely used renewable energy technologies, has great potential. However, in desertification areas, due to the dry climate, strong solar radiation, long sunshine duration, and rich land resources, although it is an advantageous area for building large centralized solar power plants, the frequent sand and dust activities in the atmosphere pose a serious challenge to the performance of solar panels. Dust particles deposited on the surface of solar panels can significantly reduce the power generation efficiency. Therefore, understanding the influence mechanism of dust deposition on solar power generation devices and predicting it have become research hotspots.
Previous studies have mainly focused on the impact of dust deposition on the effective solar radiation intensity and temperature of solar cells, as well as the prediction of light transmittance. However, there is still a lack of reports on discussing the impact of dust deposition on the power generation efficiency of solar panels based on the numerical simulation of the dust deposition law on the panel surface. Therefore, this study aims to investigate the dust deposition characteristics on the surface of solar panels in desertification areas under different factors and further analyze the impact of dust deposition on the transmittance of solar panels.
2. Numerical Calculation Model
2.1 Model Establishment
To ensure the full development of the calculated flow field and turbulence, a three-dimensional calculation model is established using ICEM in this study, and the CFD fluid simulation software Fluent is adopted for numerical simulation. The simplified physical model of dust deposition on the surface of solar panels in desertification areas. The height of the bottom of the solar panel from the ground is He=0.5m, and the model size is (1.6✖3.2✖0.08)✖Hc1, with the calculation domain size of (64✖16✖12)✖Hc. The length of the solar panel in the windward direction is 16Hc, and the length in the leeward direction is 46.7Hc, which conforms to the 1:10 scale model proposed by Tominaga et al. Due to the presence of the solar panel, the calculation region of the model has an irregular shape. Therefore, the hexahedral mesh generation method is used, and the meshes on the surface of the solar panel and its vicinity are locally refined.
2.2 Governing Equations
In the numerical calculation of this paper, since the flow velocity of the flow field is much less than 102.08m/s, the wind field to be calculated can be treated as a three-dimensional incompressible flow field. The basic equations satisfied by the wind field are as follows:
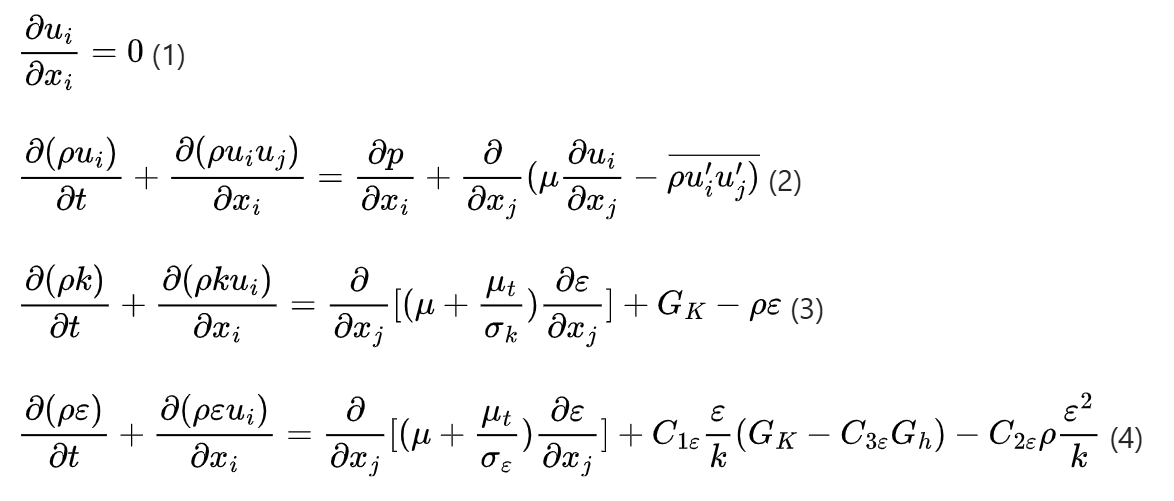
where is the time-averaged value of the pulsation, is the spatial coordinate of the fluid particle, u’i is the velocity pulsation value, the overline represents the time average, the fluid viscosity coefficient μ=1.8✖10^-5, μt is the turbulent viscosity coefficient which can be calculated by μt=0.09ρCp(k^2/ε), Gb is the generation term of turbulent kinetic energy caused by buoyancy, Gk is the generation term of turbulent kinetic energy caused by the average velocity gradient C1ε, C2ε, C3ε, are empirical constants, and σk , σε are the Prandtl numbers corresponding to the turbulent kinetic energy and the dissipation rate, respectively.
2.3 Boundary Conditions and Simulation Settings
The fluid flows in from the left side and freely outflows from the right side. The inlet boundary condition is set as the velocity inlet, and the initial velocity at the inlet is set to the logarithmic profile U=u*/k IN y/z0 using UDF, where u* is the friction wind speed, k=0.41 (kappa is the Karman constant), and z0=0.025 is the roughness. The Symamlal – obrien force model is selected. The top and both sides of the calculation domain adopt the symmetric boundary, and the bottom of the calculation domain and the solar panel model adopt the no-slip wall condition. The SIMPLE algorithm is used for the solution calculation, and the second-order upwind scheme is adopted for the discrete format. The calculation convergence condition is that the change trend of each component reaches stability.
In this study, the relationship between the dust deposition density and the output efficiency of the solar panel under different environmental conditions is mainly studied. Therefore, when the installation inclination is 35° and the dust particle size is , four different orders of magnitude of the inlet dust volume fractions (5✖10^-3%, 5✖10^-4%, 5✖10^-5%, 5✖10^-6%) are selected for calculation and simulation; when the inlet dust volume fraction is 5✖10^-4% and the installation inclination is 35° , the dust particle sizes of 1μm, 10μm, 20μm, 30μm, 40μm, and 50μm are selected for research, which is consistent with the particle size selected in the literature
2.4 Calculation of Dust Deposition Amount and Transmittance
The calculation formula for the dust deposition amount on the surface of the solar panel is as follows:
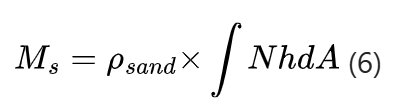
where Ms is the mass of sand grains, ρsand=2650kg/m^3 is the mass density of sand grains, N is the number of deposited sand grains per unit volume, h is the height of the first layer of meshes on the surface of the solar panel, which is approximately equal to the particle diameter, and NhdA is the total volume of dust deposited on the surface of the solar panel.
After obtaining the dust deposition amount on the surface of the solar panel, the impact on the light transmittance of the solar panel can be analyzed. Studies have shown that when solar radiation passes through a solar panel with dust on its surface, the effective radiation intensity conforms to the Lambert – Beer law, and the light transmittance T of the solar panel surface satisfies the following relationship with the deposited dust mass M and the equivalent particle size γv:
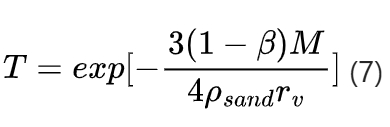
where, since the sand grains are translucent, it is assumed that the transparency β=0.45. Thus, the impact of dust deposition on the transmittance of the solar panel can be calculated.
3. Simulation Results and Analysis
3.1 Flow Field Structure and Dust Deposition Distribution
The air flow streamlines and wind speed fields near the solar panel at different installation angles when the inlet volume fraction is 5✖10^-4% and the dust particle size is 10μm. The dust velocity on the leeward side of the solar panel is relatively small, and sand accumulation is likely to occur on the leeward side. Separation vortices will be formed on the back of the panel at different installation angles, and the separation vortices will gradually increase with the increase of the installation angle, resulting in an increase in the amount of sand accumulation, especially for small particle size dust. In addition, the wind speed near the solar panel surface is significantly reduced due to the obstruction of the solar panel, but it will gradually recover along the panel surface.
| Installation Angle | Description of Flow Field and Dust Deposition |
|---|---|
| 15° | Dust velocity and flow field characteristics at 15° inclination |
| 25° | Dust velocity and flow field characteristics at 25° inclination |
| 35° | Dust velocity and flow field characteristics at 35° inclination |
| 45° | Dust velocity and flow field characteristics at 45° inclination |
The variation law of the wind speed near the solar panel surface at different installation angles when the inlet wind speed is logarithmic. It can be seen that when the inclination is small, the wind speed near the solar panel surface slowly increases from the bottom to the top along the panel surface. When the inclination increases from 25° to 75°, the wind speed near the solar panel surface first decreases and then increases from the bottom to the top, and the larger the inclination, the more drastic the change in wind speed. This change indicates that the dust deposition on the solar panel surface may be non-uniformly distributed, which will make the impact of dust deposition on the solar panel extremely complex.
The dust deposition distribution law on the surface of the solar panel when the installation angle of the solar panel is 35°, the sand particle size is 50μm, and the inlet wind speed is logarithmic. It can be seen that when the inlet dust concentration is different, the number and distribution law of the dust particles deposited on the solar panel are also different. However, the dust will be concentrated to a certain extent at the bottom edge of the solar panel, and when the wind – sand flow climbs from the bottom of the panel to the top, the dust deposition amount shows obvious stratification, and the larger the inlet volume fraction, the more obvious the stratification. In addition, the dust deposition amount in the center of the solar panel is small, and the dust deposition at the top of the solar panel is the least. This result is similar to that in the literature , indicating that the simulation results in this paper have a certain reliability.
3.2 Relationship between Dust Deposition Amount and Environmental Factors
The variation curves of the dust deposition amount on the surface of the solar panel under different conditions. It can be seen that with the increase of the inlet dust volume fraction and the dust particle size, the deposition amount on the surface of the solar panel shows an exponential increasing trend. However, with the increase of the installation inclination of the solar panel, the deposition amount on the surface of the solar panel first increases and then decreases, and the deposition amount reaches the maximum when the inclination is 50°.
| Factor | Relationship with Dust Deposition Amount |
|---|---|
| Inlet Dust Volume Fraction | Exponential increase with the increase of volume fraction |
| Dust Particle Size | Exponential increase with the increase of particle size |
| Installation Inclination | First increase and then decrease, maximum at |
3.3 Impact of Dust Deposition on Solar Panel Transmittance
The impact of dust deposition on the transmittance of the solar panel. It can be seen that with the increase of the installation inclination, the impact of dust deposition on the transmittance of the solar panel surface first increases and then decreases, and the attenuation of the transmittance is the largest when the installation inclination is 50°. This change trend is consistent with the change of the dust deposition amount.
4. Conclusion
In this study, the fluid dynamics simulation method is used to study the flow field structure around the solar panel in the desertification area and the dust deposition law on the inclined solar panel in the wind – sand flow with different concentrations and particle sizes. Based on this, the impact of dust deposition on the transmittance of the solar panel is analyzed. The numerical simulation results show that:
- Separation vortices will be formed on the back of the solar panel at different installation angles, and the separation vortices will gradually increase with the increase of the installation angle, resulting in an increase in the amount of sand accumulation.
- The flow field near the small inclination solar panel surface slowly increases. With the increase of the installation angle, the wind speed near the panel surface first decreases and then increases, and the larger the panel inclination, the more drastic the wind speed change.
- With the increase of the dust concentration and particle size in the atmosphere, the deposition amount on the surface of the solar panel shows an exponential increasing trend. However, with the increase of the installation inclination of the solar panel, the deposition amount on the surface of the solar panel first increases and then decreases, and the deposition amount reaches the maximum when the inclination is . The transmittance of the dust-covered solar panel shows a similar change law with the change of its inclination.
These results provide important references for the construction and safe operation of solar power plants in desertification areas. Future research can focus on further optimizing the simulation model, exploring more effective dust prevention and cleaning measures, and improving the power generation efficiency and service life of solar panels in windy and sandy environments.